Germany’s power mix
Clean Energy Wire; National Wind Watch
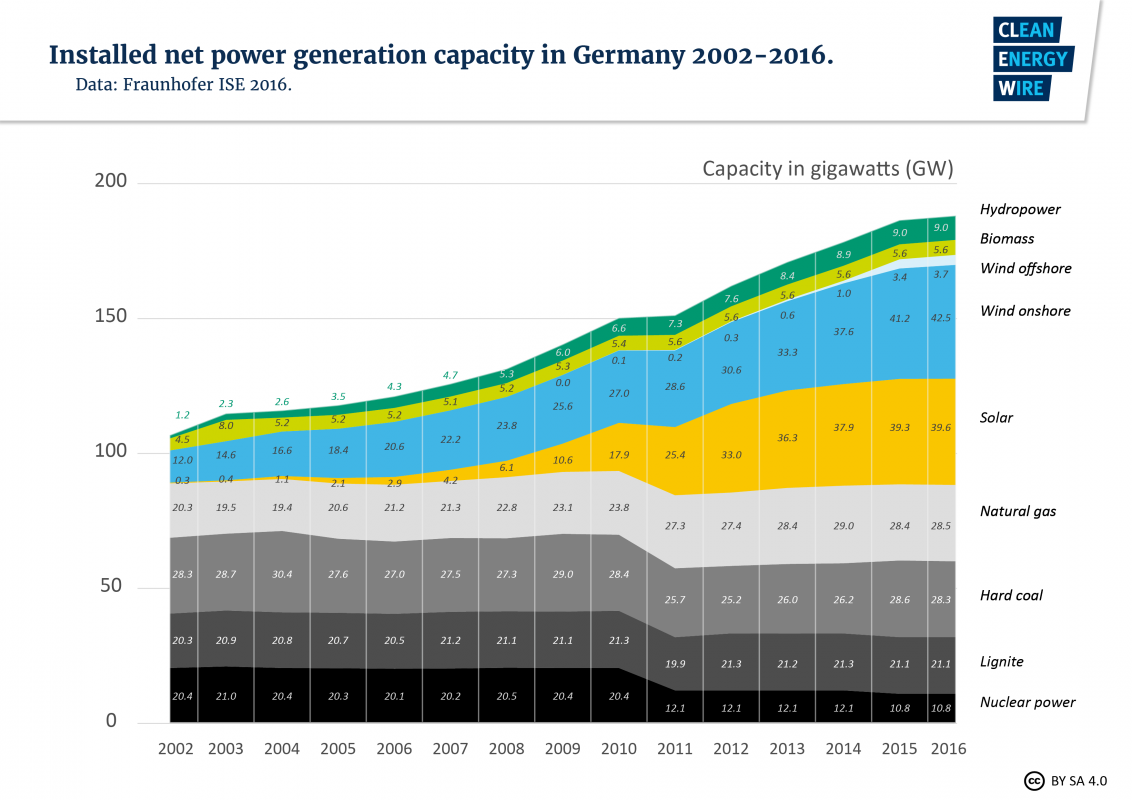
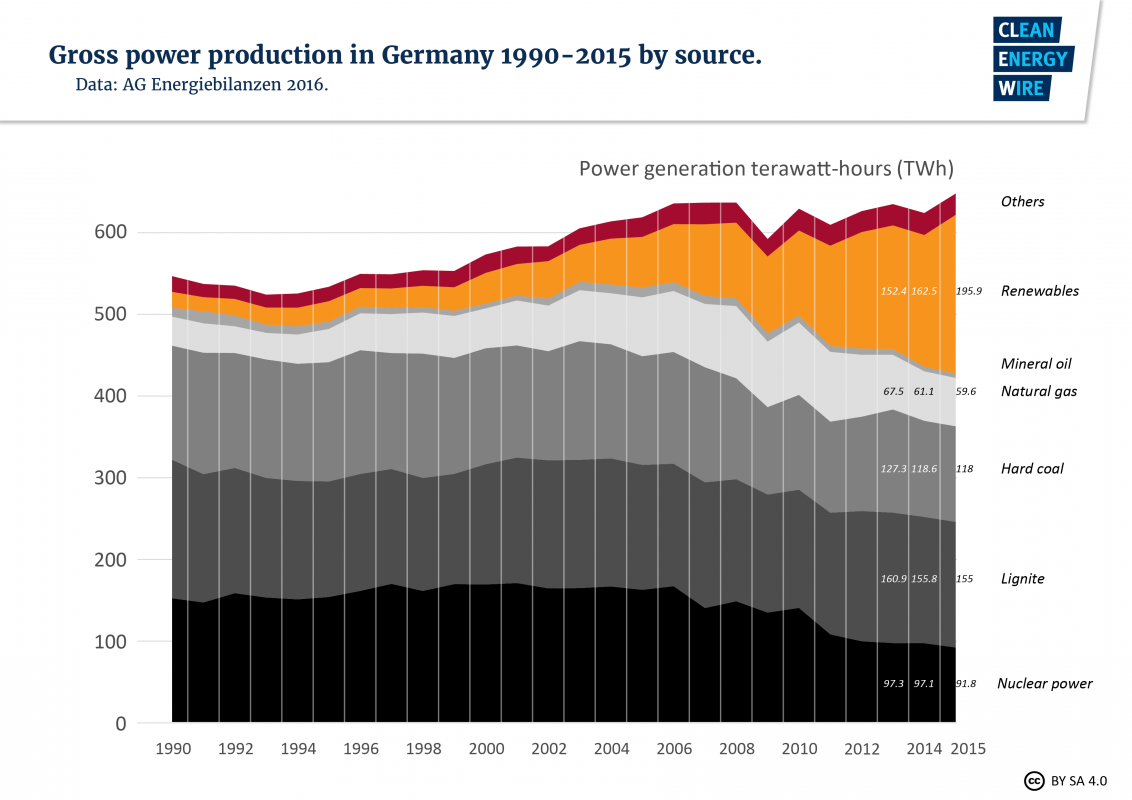
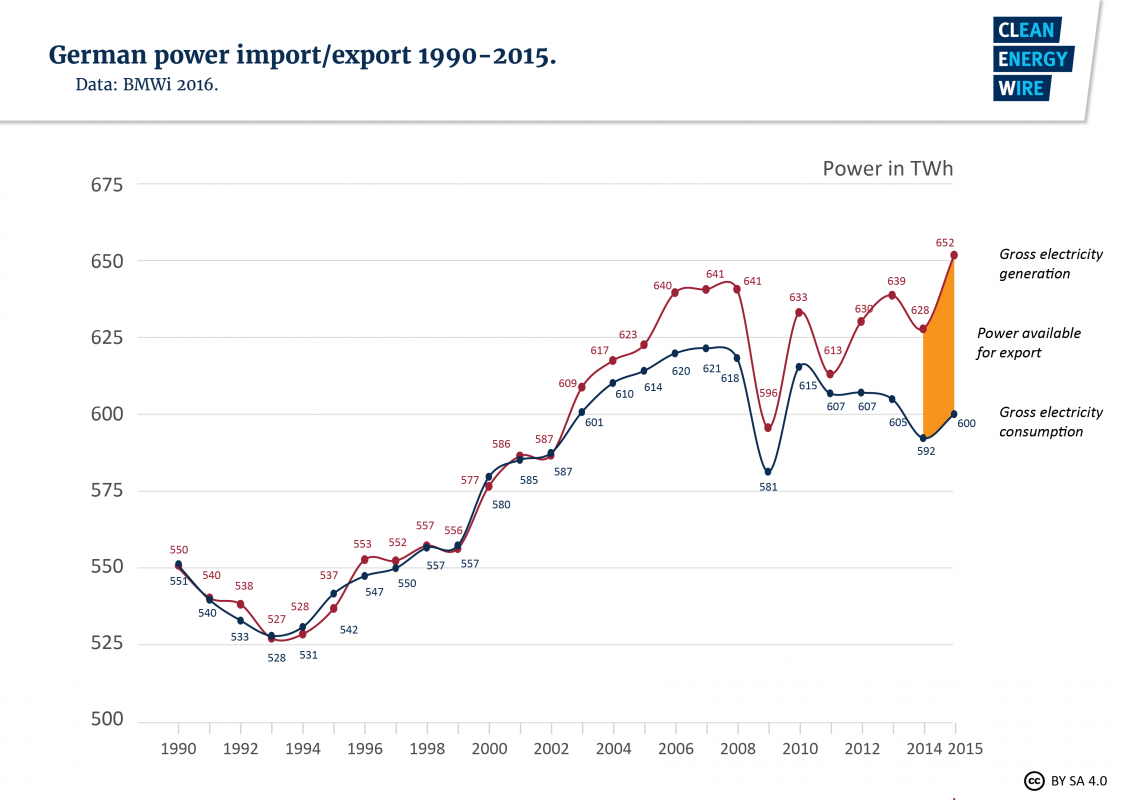
The following graphs show: 1) Installed net power generation capacity in Germany 2002–2016; 2) Gross power production in Germany 1990–2015 by source; and 3) German power import/export 1990–2015.
 [1]
[1]
Note that since 2011, the capacity of nonrenewable sources has not decreased. The slight decrease in nuclear was made up for by an increase in coal.
 [2]
[2]
Electricity production from coal and natural gas has hardly decreased, even with the substantial increase of production from renewables.
 [3]
[3]
Since 2002, when the share of electricity production from renewables approached 10%, overproduction steadily increased. In other words, electricity production from renewables – which does not follow actual demand and in the case of wind is highly variable – was mostly exported into the larger regional grid when it could no longer be absorbed by the domestic grid.
URL to article: https://www.wind-watch.org/documents/germanys-power-mix/
URLs in this post:
[1] Image: https://docs.wind-watch.org/DE-capacity.png
[2] Image: https://docs.wind-watch.org/DE-production.png
[3] Image: https://docs.wind-watch.org/DE-import-export.png