World: Current electricity production and consumption of “low-carbon” and “renewable” electricity – click an area for details [1]
Europe: Quarter-hour load, generation, exchange – click on sample graph for other countries [2]
Europe: Hourly and daily generation, capacity factors [3]
Nordpool: Current production by source type in the Nordic power system (Norway, Sweden, Finland, Estonia, Latvia, Lithuania, Denmark) [4]
Nordpool: Current power flow in the Nordic power system [5]
West Denmark: Electricity prices, consumption, and production today, every 5 minutes [6]
France: Quarter-hour consumption and production [7]
France: Current, weekly, monthly, yearly demand and production [8]
Germany: Quarter-hour net electricity generation [9]
Germany: Quarter-hour wind production in EnBW control area (Baden-Württemberg) [10]
UK: current and last, week, and year electricity from wind [11]
Great Britain: Last 24 hours of generation by fuel type, every 5 minutes [12]
Great Britain: Current, weekly, monthly, yearly demand and production [13]
Ireland: Daily quarter-hour wind generation and system demand [14]
Ireland: Quarter-hour system demand and fuel mix [15]
Spain: 10-minute demand and generation share [16]
Wind Energy Generation in the Australian Energy Market: by facility, every 5 minutes, past 24 hours, previous day, and (3-hourly) mprevious onth [17]
Australia: Australian Energy Market Operator (AEMO, southern and eastern Australia): 5-minute and up to past year regional generation and fuel mix [18]
Australia: AEMO grid (National Electricity Market): 5- and 30-minute regional generation and fuel mix [19]
Alberta: Monthly wind power forecast vs. actual comparison reports [20]
Ontario: Latest hour of generation [21]
Ontario: Daily hourly generation [22] (scroll to bottom of table for wind plant)
Ontario: Hourly generation and other power data [23]
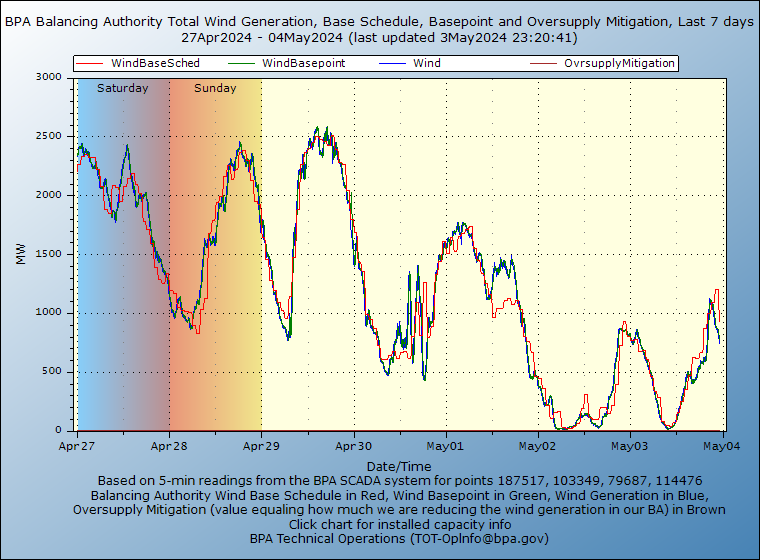
Northwestern USA: Previous week, real-time 5-minute wind generation, Bonneville Power Administration [24]
 [25]
[25]
California: Daily hourly production, CAISO [26] [click here to download complete report (PDF) from previous day. [27]]
 [28]
[28]
Southwest Power Pool: current (15-minute) generation mix [29]
(Oklahoma, Kansas, Nebraska, South Dakota, North Dakota)
Midcontinent ISO fuel mix [30]
New England fuel mix (ISO-NE) [31]
Barnstable, Massachusetts: hourly, daily, weekly, monthly, yearly production and consumption of a 100-kW turbine since June 1, 2011 [32] (100% daily generation would be 2,400 kWh)
Scituate, Massachusetts: hourly, daily, weekly, monthly, yearly production and consumption of a 1.5-MW turbine since March 30, 2012 [33] (100% daily generation would be 36,000 kWh)
Mark Richey Woodworking, Newburyport, Massachusetts: hourly, daily, monthly production of a 600-kW turbine since June 2009 [34] (100% daily generation would be 14,400 kWh)
University of Delaware, Newark: current power output (kW) of 2,000-kW turbine [35]
URL to article: https://www.wind-watch.org/documents/real-time-wind-production-various-regions/
URLs in this post:
[1] World: Current electricity production and consumption of “low-carbon” and “renewable” electricity – click an area for details: https://app.electricitymaps.com/map
[2] Europe: Quarter-hour load, generation, exchange – click on sample graph for other countries: https://transparency.entsoe.eu/dashboard/show
[3] Europe: Hourly and daily generation, capacity factors: https://windeurope.org/about-wind/daily-wind/hourly-generation
[4] Nordpool: Current production by source type in the Nordic power system (Norway, Sweden, Finland, Estonia, Latvia, Lithuania, Denmark): https://www.statnett.no/en/for-stakeholders-in-the-power-industry/data-from-the-power-system/#nordic-power-balance
[5] Nordpool: Current power flow in the Nordic power system: https://www.statnett.no/en/for-stakeholders-in-the-power-industry/data-from-the-power-system/#nordic-power-flow
[6] West Denmark: Electricity prices, consumption, and production today, every 5 minutes: http://www.emd.dk/el/
[7] France: Quarter-hour consumption and production: https://www.rte-france.com/eco2mix/la-production-delectricite-par-filiere
[8] France: Current, weekly, monthly, yearly demand and production: http://www.gridwatch.templar.co.uk/france/
[9] Germany: Quarter-hour net electricity generation: https://energy-charts.info/charts/power/chart.htm?l=en&c=DE
[10] Germany: Quarter-hour wind production in EnBW control area (Baden-Württemberg): http://www.transnetbw.de/en/key-figures/renewable-energies/wind-infeed
[11] UK: current and last, week, and year electricity from wind: https://winderful.uk/
[12] Great Britain: Last 24 hours of generation by fuel type, every 5 minutes: https://www.bmreports.com/bmrs/?q=generation/fueltype
[13] Great Britain: Current, weekly, monthly, yearly demand and production: http://www.gridwatch.templar.co.uk/
[14] Ireland: Daily quarter-hour wind generation and system demand: http://smartgriddashboard.eirgrid.com
[15] Ireland: Quarter-hour system demand and fuel mix: http://www.eirgridgroup.com/how-the-grid-works/system-information/
[16] Spain: 10-minute demand and generation share: https://demanda.ree.es/visiona/peninsula/nacional/total
[17] Wind Energy Generation in the Australian Energy Market: by facility, every 5 minutes, past 24 hours, previous day, and (3-hourly) mprevious onth: https://anero.id/energy/wind-energy
[18] Australia: Australian Energy Market Operator (AEMO, southern and eastern Australia): 5-minute and up to past year regional generation and fuel mix: https://visualisations.aemo.com.au/aemo/apps/visualisation/index.html#/electricity/nem/fuel-mix
[19] Australia: AEMO grid (National Electricity Market): 5- and 30-minute regional generation and fuel mix: https://opennem.org.au/energy/nem/?range=7d&interval=30m
[20] Alberta: Monthly wind power forecast vs. actual comparison reports: http://www.aeso.ca/gridoperations/20877.html
[21] Ontario: Latest hour of generation: http://live.gridwatch.ca/home-page.html
[22] Ontario: Daily hourly generation: http://www.sygration.com/gendata/today.html
[23] Ontario: Hourly generation and other power data: https://www.ieso.ca/power-data
[24] Northwestern USA: Previous week, real-time 5-minute wind generation, Bonneville Power Administration: https://transmission.bpa.gov/business/operations/Wind/twndbspt.aspx
[25] Image: https://transmission.bpa.gov/business/operations/Wind/twndbspt.png
[26] California: Daily hourly production, CAISO: http://www.caiso.com/green/renewableswatch.html
[27] click here to download complete report (PDF) from previous day.: http://content.caiso.com/green/renewrpt/DailyRenewablesWatch.pdf
[28] Image: http://www.caiso.com/green/renewrpt/DailyRenewablesWatch.pdf
[29] Southwest Power Pool: current (15-minute) generation mix: https://portal.spp.org/pages/integrated-marketplace-generation-mix
[30] Midcontinent ISO fuel mix: https://api.misoenergy.org/MISORTWD/dashboard.html?fuelMix
[31] New England fuel mix (ISO-NE): https://www.iso-ne.com/isoexpress/web/charts/guest-hub?p_p_id=fuelmixgraph_WAR_isoneportlet_INSTANCE_WQKSMAX9RozI&p_p_lifecycle=0&p_p_state=pop_up
[32] Barnstable, Massachusetts: hourly, daily, weekly, monthly, yearly production and consumption of a 100-kW turbine since June 1, 2011: http://www.powerdash.com/systems/1000401/
[33] Scituate, Massachusetts: hourly, daily, weekly, monthly, yearly production and consumption of a 1.5-MW turbine since March 30, 2012: http://www.powerdash.com/systems/1000498/
[34] Mark Richey Woodworking, Newburyport, Massachusetts: hourly, daily, monthly production of a 600-kW turbine since June 2009: https://www.markrichey.com/sustainability
[35] University of Delaware, Newark: current power output (kW) of 2,000-kW turbine: http://www.ceoe.udel.edu/lewesturbine/
Click here to print.

