


| Wind Watch is a registered educational charity, founded in 2005. |
Real-time wind production — various regions
Author: | Alberta, Arizona, Australia, California, Connecticut, Delaware, Denmark, Germany, Grid, Idaho, Illinois, Indiana, Iowa, Ireland, Italy, Kansas, Latvia, Lithuania, Maine, Manitoba, Massachusetts, Michigan, Minnesota, Nebraska, Netherlands, New Hampshire, New Mexico, North Dakota, Oklahoma, Ontario, Oregon, Poland, Portugal, Rhode Island, South Dakota, Spain, U.K., Washington
Translate: FROM English | TO English
Translate: FROM English | TO English
Europe: Quarter-hour load, generation, exchange – click on sample graph for other countries
Europe: Hourly and daily generation, capacity factors
Nordpool: Current power flow in the Nordic power system
West Denmark: Electricity prices, consumption, and production today, every 5 minutes
France: Quarter-hour consumption and production
France: Current, weekly, monthly, yearly demand and production
Germany: Quarter-hour net electricity generation
Germany: Quarter-hour wind production in EnBW control area (Baden-Württemberg)
UK: current and last, week, and year electricity from wind
Great Britain: Last 24 hours of generation by fuel type, every 5 minutes
Great Britain: Current, weekly, monthly, yearly demand and production
Ireland: Daily quarter-hour wind generation and system demand
Ireland: Quarter-hour system demand and fuel mix
Spain: 10-minute demand and generation share
Alberta: Monthly wind power forecast vs. actual comparison reports
Ontario: Latest hour of generation
Ontario: Daily hourly generation (scroll to bottom of table for wind plant)
Ontario: Hourly generation and other power data
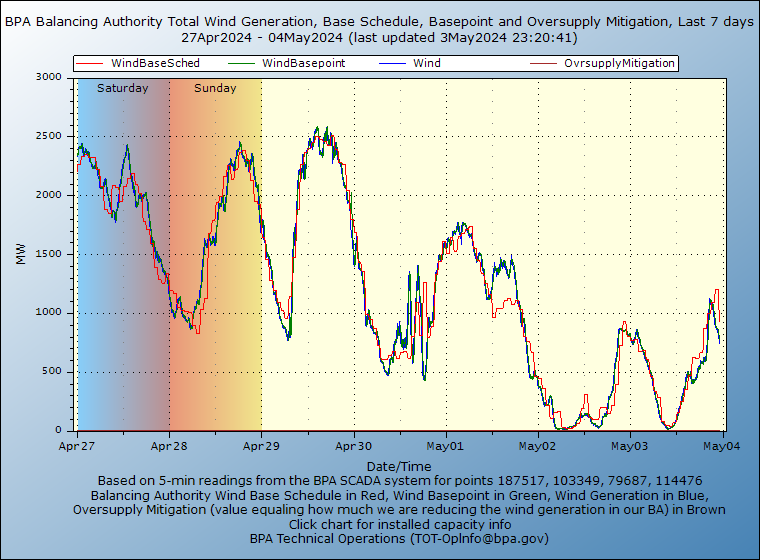
Northwestern USA: Previous week, real-time 5-minute wind generation, Bonneville Power Administration
California: Daily hourly production, CAISO [click here to download complete report (PDF) from previous day.]

Southwest Power Pool: current (15-minute) generation mix
(Oklahoma, Kansas, Nebraska, South Dakota, North Dakota)
Barnstable, Massachusetts: hourly, daily, weekly, monthly, yearly production and consumption of a 100-kW turbine since June 1, 2011 (100% daily generation would be 2,400 kWh)
Scituate, Massachusetts: hourly, daily, weekly, monthly, yearly production and consumption of a 1.5-MW turbine since March 30, 2012 (100% daily generation would be 36,000 kWh)
Mark Richey Woodworking, Newburyport, Massachusetts: hourly, daily, monthly production of a 600-kW turbine since June 2009 (100% daily generation would be 14,400 kWh)
University of Delaware, Newark: current power output (kW) of 2,000-kW turbine
This material is the work of the author(s) indicated. Any opinions expressed in it are not necessarily those of National Wind Watch.
The copyright of this material resides with the author(s). As part of its noncommercial educational effort to present the environmental, social, scientific, and economic issues of large-scale wind power development to a global audience seeking such information, National Wind Watch endeavors to observe “fair use” as provided for in section 107 of U.S. Copyright Law and similar “fair dealing” provisions of the copyright laws of other nations. Queries e-mail.
| Wind Watch relies entirely on User Funding |
 (via Stripe) |
 (via Paypal) |
Share:


 [ Short URLs: https://wind-watch.org/doc/?p=1398 | http://wndfo.net/D1398 ]
Tags: Wind power, Wind energy


