Abstract – Population viability analyses (PVA) are now routinely used during the consenting process for offshore wind energy developments to assess potential impacts to vulnerable species, such as seabirds. These models are typically based on mean vital rates, such as survival and fecundity, with some level of environmental stochasticity (i.e., temporal variation). However, many species of seabird are experiencing population decline due to temporal (i.e., directional) trends in their vital rates. We assess the prevalence of temporal trends in rates of fecundity for a sentinel species of seabird, the black-legged kittiwake Rissa tridactyla, and examine how accounting for these relationships affects the predictive accuracy of PVA, as well as the projected population response to an extrinsic threat. We found that temporal trends in kittiwake rates of fecundity are widespread, and that including these trends in PVA assessments dramatically influences the projected rate of population decline. We advocate that model validation become a prerequisite step in seabird PVA assessments to identify potential biases influencing the projected population response. We also argue that environmental factors driving current population dynamics need to be incorporated in PVA impact assessments as potential “worst-case” scenarios. These findings have immediate application for improving and reducing uncertainty in impact assessments conducted as part of the consenting process for offshore wind energy developments.
 [1]
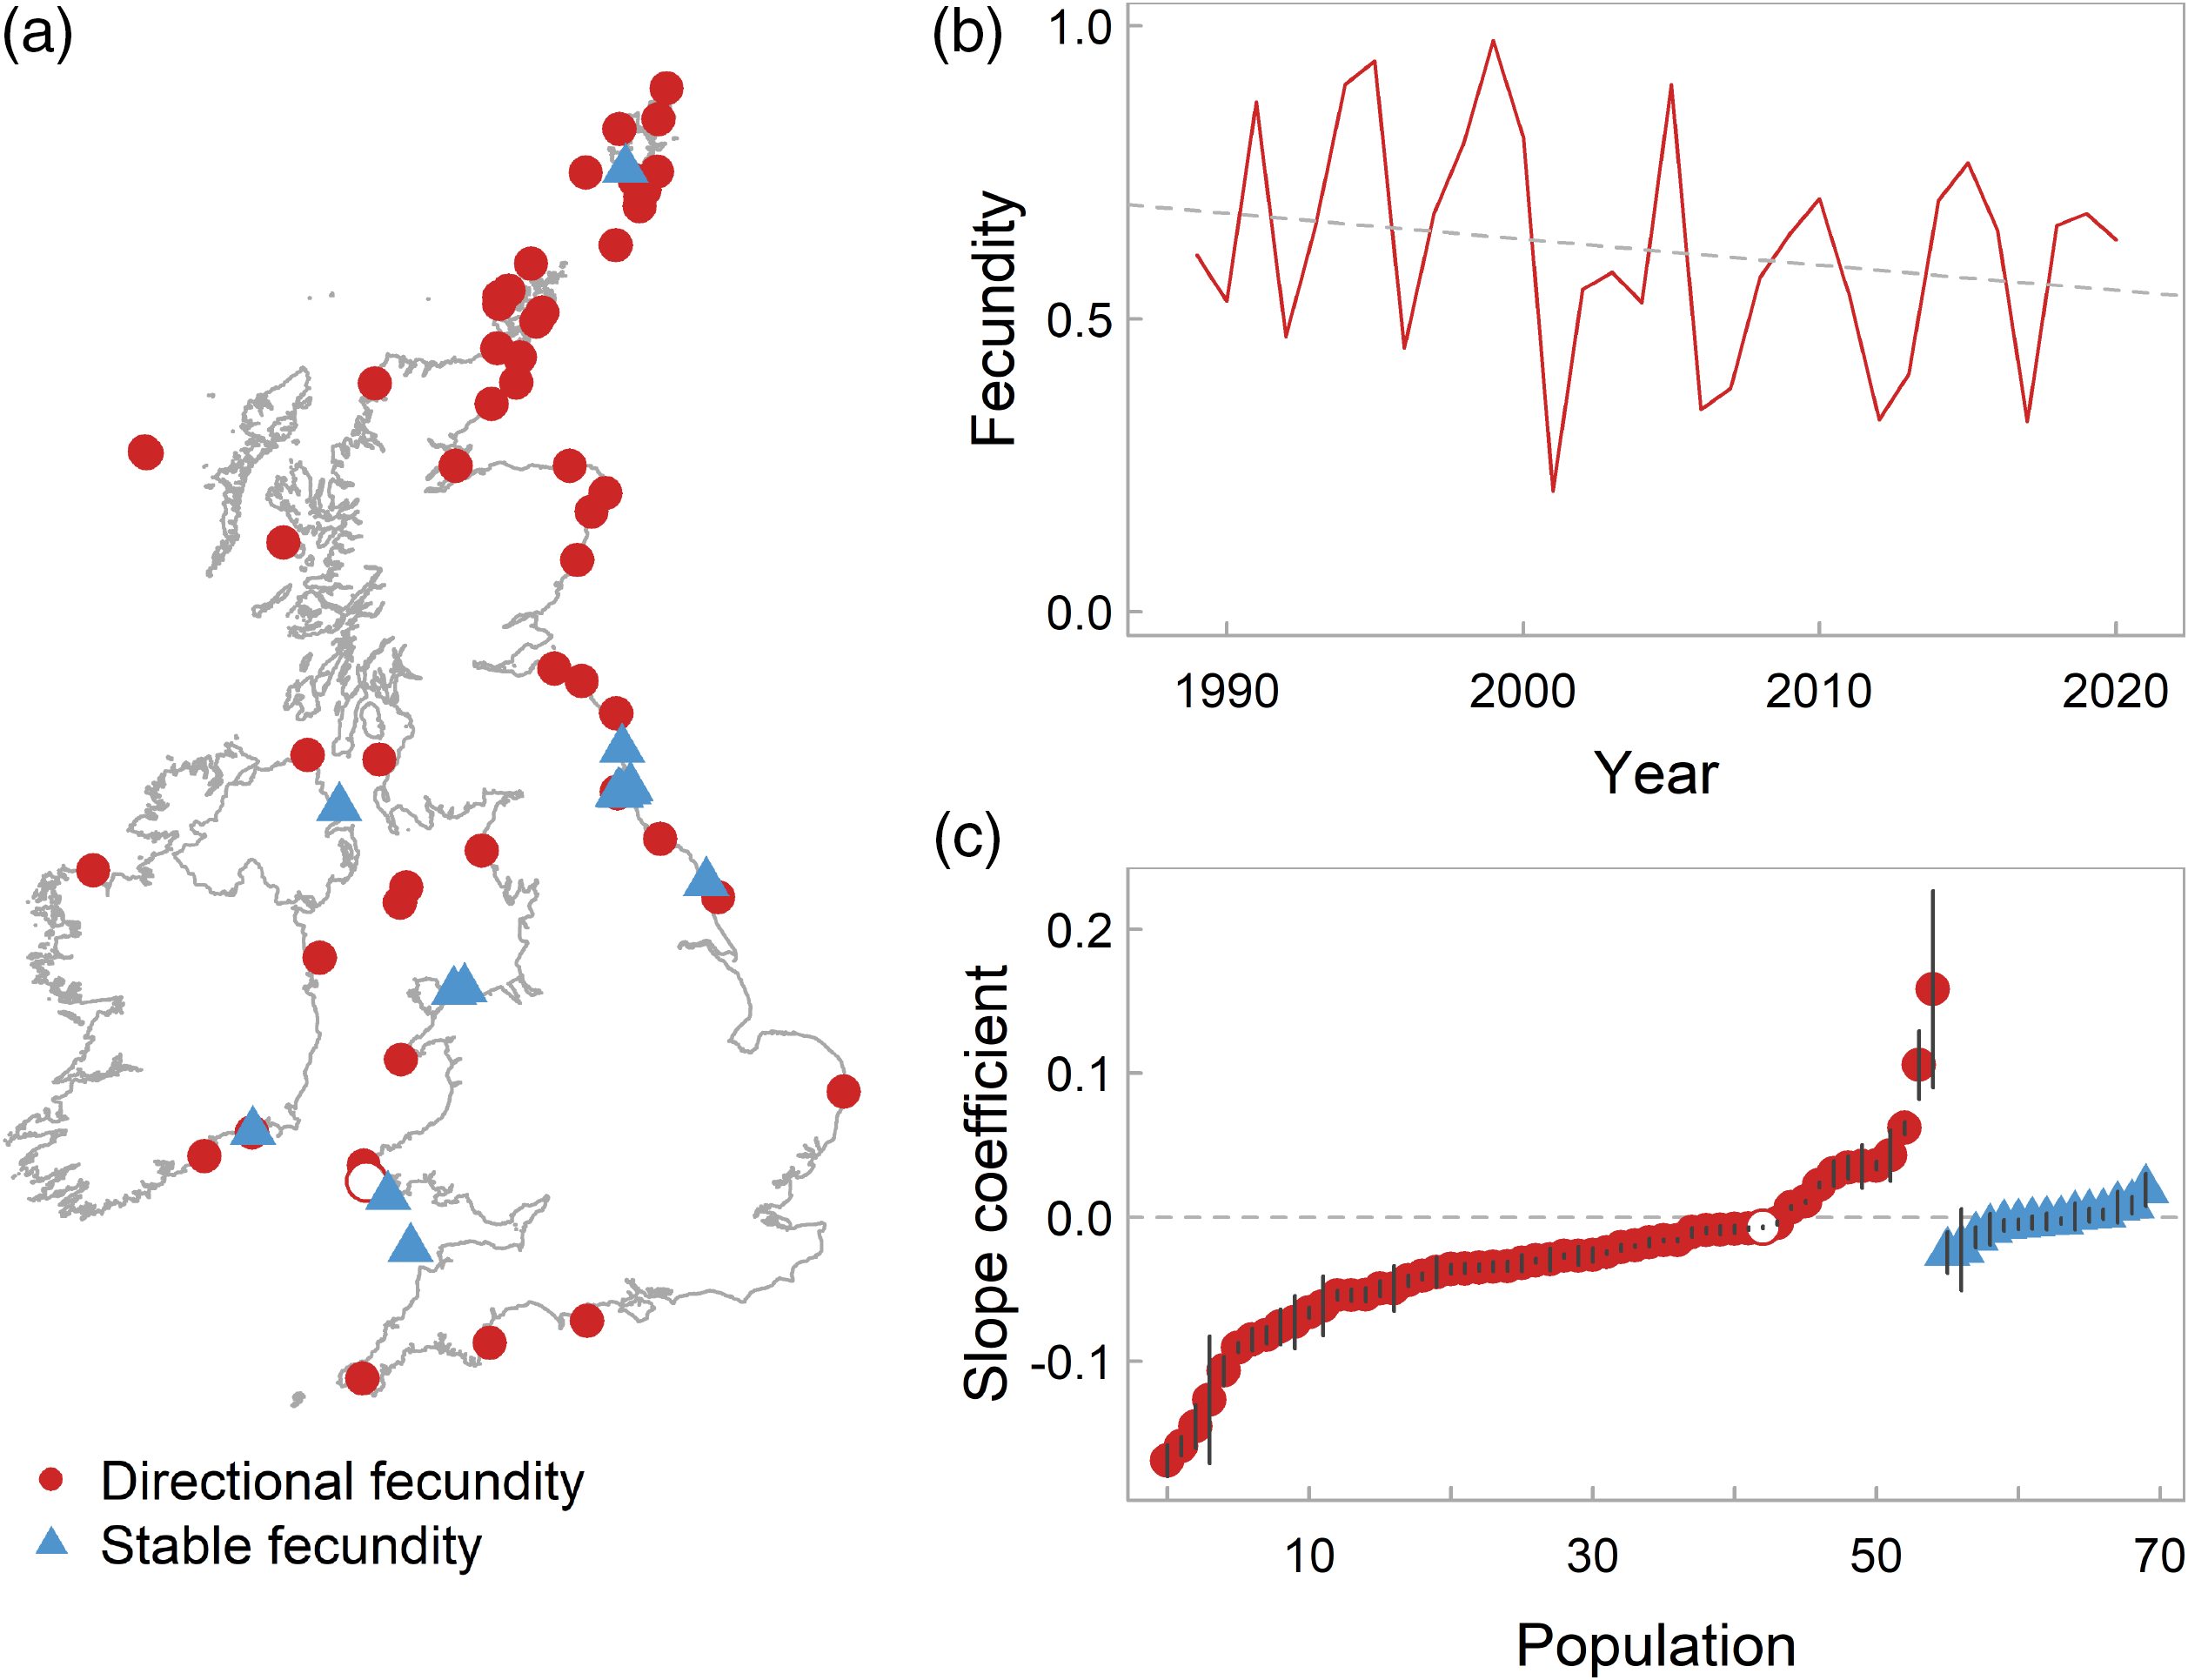
[1]a) Temporal (i.e., directional) trends in rates of fecundity are widespread amongst populations of kittiwakes in the UK and Ireland. Colonies with significant temporal trends in fecundity shown as red circles, those with stable fecundity shown as blue triangles. Skomer (South Wales) shown as an open red circle. (b) Fecundity of kittiwakes on Skomer Island declined at a constant rate between 1989 and 2020. Dashed line shows a linear regression fitted through the data. (c) We found high variation in the strength of temporal trends estimated using colony-specific Poisson GLMs. Slope coefficient values shown with standard error. Colonies with directional fecundity shown as red circles, those with stable fecundity shown as blue triangles. Skomer shown as open red circle. Gray dashed line at zero for reference.
Catharine Horswill, ZSL Institute of Zoology, London, Centre for Biodiversity and Environmental Research, Department of Genetics, Evolution and Environment, University College London, and Department of Zoology, University of Cambridge, UK
Julie A.O. Miller, Marine Scotland Science, Marine Laboratory, Aberdeen, UK
Matt J. Wood, School of Natural and Social Sciences, University of Gloucestershire, Cheltenham, UK
Conservation Science and Practice. 13 March 2022. doi: 10.1111/csp2.12644 [2]
Download original document: “Impact assessments of wind farms on seabird populations that overlook existing drivers of demographic change should be treated with caution [3]”
URLs in this post:
[1] Image: https://docs.wind-watch.org/Horswill-Fig1.png
[2] doi: 10.1111/csp2.12644: https://doi.org/10.1111/csp2.12644
[3] Impact assessments of wind farms on seabird populations that overlook existing drivers of demographic change should be treated with caution: https://docs.wind-watch.org/Horswill-Impact-assessments-wind-farms-seabird-populations.pdf