
| Wind Watch is a registered educational charity, founded in 2005. |
Hidden consequences of intermittent electricity production
Author: | Economics, Germany, Grid
Translate: FROM English | TO English
Translate: FROM English | TO English
If the aim is to decarbonize the electricity sector and phase out nuclear power, then renewable energy remains as the only source of electricity. As wind and solar photovoltaics (PV) are a major fraction (in Germany about 65% of the total renewable electricity production) one then must cope with strong intermittency. The consequences show up most prominently during dark and cloudy periods without wind.
The reality of this last statement is illustrated in Fig. 1, showing the evolution of the electricity production in Germany for January 2017. Due to lack of wind and sunshine in the second half of January most of the German electricity during that whole period was produced by conventional power sources – lignite, coal, gas and nuclear power. On the morning of the 24th of January 2017 a nearly total collapse of the German electricity supply took place. It could have had consequences throughout Europe and was only avoided by putting into operation all possible fossil power plants in Germany, including the oldest and dirtiest ones.

Fig. 1: Electrical power consumption and production in Germany (in MW) by various sources for January 2017: grid load (brown), sum of onshore and offshore wind (blue), solar PV (yellow), installed iRES [intermittent renewable energy sources] capacity (light green background color). Although the iRES capacity is exceeding the grid load, it could only provide a fraction of the German electrical power needs during this dark period without sufficient wind and most of the power was produced by conventional power sources (fossil and nuclear). Especially the period 16-25 January 2017 demonstrates the need for large additional backup power systems (that are evidently non-renewable) or storage.
This graph also leaves no doubt about the storage problem. During the 10 days between 16 and 25 January, equivalent to 240h, the difference between the iRES produced electrical power and the electrical power needs of Germany varied between 50 and 60GW, i.e. between 12000 and 14400 GWh of electrical energy was missing. German electrical storage systems could not have supplied this large amount of energy, as the total storage capacity in Germany is about 40GWh (mainly hydro). The missing electrical energy represents thus 300-360 times the German electrical storage capacity. Including also the 12 dark and wind still days in December 2016, the missing energy would increase to about 32TWh, i.e. about 800 times the currently existing storage capacity in Germany. Note that such long low iRES power production intervals are not an exception; similarly, long periods of low combined solar PV and wind power production were observed regularly in the past years, not only in Germany but in several EU countries and predominantly simultaneously, see also below. …
The electricity production from renewable systems is characterized by a low capacity factor. In Germany with its large fleet of wind and solar PV systems, this is ~15%, resulting from ~11% for solar PV and ~18% for wind (sum of offshore and onshore wind). The consequences are shown in Fig. 2, documenting the evolution in Germany of the installed capacity and power production from solar PV and wind; also indicated are the minimum and maximum power load of the grid. It is clear (i) that although the iRES installed capacity is huge (exceeding at the moment already the maximum power load on the German grid), its contribution to the German electrical energy needs is limited and (ii) that the peaks of the iRES production increasingly cross the lines of minimum load, thus leading to more and more excess production. For the moment export to neighboring countries is still a solution. But this will have to change when the iRES production in other EU countries also will increase in the near future.

Fig. 2: Electrical power production (in GW) by wind (blue) and the sum of solar PV and wind (red) compared with maximum and miminum grid load. As the installed renewable capacity increases, the minimum grid load is increasingly exceeded, leading to overcapacity and export of surplus energy, often at negative prices. …
Export of electricity is needed not only on days with a large iRES power production, but paradoxically also on days with a minimal iRES power production. Indeed, on such days the backup production is maximal and cannot be easily regulated in the short time intervals, which characterize the intermittency of the renewable power from sun and wind. At low iRES production most of the iRES power serves only to increase the export (in several cases at negative prices) as illustrated in Figs. 4a and b and discussed in detail in D. Ahlborn, H. Jacobi, World of Mining, Surface and Underground 68, 2-6 (2016). Thus it comes as no surprise that there is a clear correlation between iRES power production (low or high) and export of electricity from Germany, as illustrated in Fig. 4b. This power is not totally lost, as it can help other countries to reduce their CO₂ output. However, the German taxpayer pays for this, and such a solution can only be temporary. Contrary to what one would expect, these massive and rather unpredictable imports are not really welcomed in the concerned neighboring countries as (i) local power plants have to reduce or shut down, reducing their profitability, and (ii) it increasingly causes overloads in the national grids of those countries. For such reasons Poland and the Czech Republic are installing phase shift transformers at their borders (paid by Germany) to reflect any dangerously high excess electrical energy imports back to Germany.
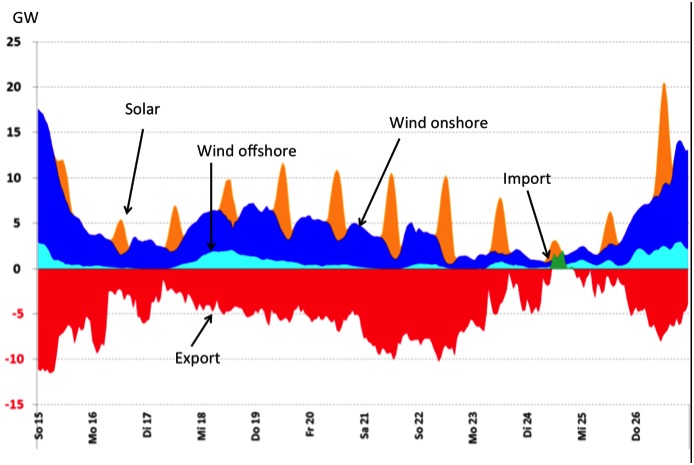
Fig. 4a: Example of the time evolution of iRES renewable electricity production during a dark and wind still period and compared to the electricity export for Germany (16-25 Jan 2017)

Fig. 4b: Hourly correlation between electricity production from renewable sources (wind + PV) and electricity export in Germany (February 2015)
These exports can only be a temporary solution because the same weather patterns often cover large surfaces of Europe. The consequence thereof is illustrated in Fig. 5, showing a comparison between the instantaneous wind power production from Germany and the sum of the wind production in 15 other EU countries: except for Spain, the correlation in the electricity production between the different countries is clearly visible. Excess wind power in Germany signifies thus also excess wind power in neighbouring countries. The difference in the timing of the maxima and minima in wind production in Spain compared to the rest of Europe, can help to average the fluctuations to a certain, albeit limited extent. One could wonder if the averaging effect of solar photovoltaic power could contribute. In fact, such an effect is nearly absent, as shown by a recent study. The same study shows that if one would use a EU wide 100% iRES electrical network, able to transport excess electrical energy production between the various European countries, typical German grid fluctuations could be reduced by 35% and the maximal storage capacity by 28% (with a 30% fluctuation level on those numbers due the varying weather conditions from year to year). Interconnector lines with a capacity of tens to hundreds of GW will then be needed throughout Europe. The export (and storage) problem can thus indeed be somewhat reduced but they will be far from totally eliminated. Other solutions to avoid the enormous excess energy will have to be found.

Fig. 5: Instantaneous wind power production in MW in Germany (dark blue) compared to the wind power production from 15 EU countries (various colors), illustrating the close correlation between wind power Europe wide. This graph clearly shows consequences for export of excess intermittent electrical power between EU countries in the future, and the very limited extent of possible ‘averaging’ of excesses throughout Europe. …
A large fraction of the produced iRES power in Germany is exported. The export was nearly stable and negligible in the years before the massive introduction of renewable power and has increased ever since, with a rapid increase in the last 5 years up to about 25% of the produced renewable energy or about 55TWh (Fig. 8). The exported energy matches the yearly produced photovoltaic energy or 2/3 of the produced wind power. However, export of excess energy can only be temporary if renewable energy is to be deployed in all EU countries, given the strong correlation between the weather in neighboring countries as already discussed in Section 2.

Fig. 8. Evolution of the total iRES electrical energy production and net electrical energy export (in TWh) over the last 26 years in Germany. The total photovoltaic production (dotted orange curve) or 66% of the total wind energy production (dashed blue curve) follows remarkably close the export curve.
Go to original document: “Hidden consequences of intermittent electricity production”
This material is the work of the author(s) indicated. Any opinions expressed in it are not necessarily those of National Wind Watch.
The copyright of this material resides with the author(s). As part of its noncommercial educational effort to present the environmental, social, scientific, and economic issues of large-scale wind power development to a global audience seeking such information, National Wind Watch endeavors to observe “fair use” as provided for in section 107 of U.S. Copyright Law and similar “fair dealing” provisions of the copyright laws of other nations. Queries e-mail.
| Wind Watch relies entirely on User Funding |
 (via Stripe) |
 (via Paypal) |
Share:
![]()
![]()
![]()
![]()
![]()
![]()
![]()
![]()
![]()
![]()
![]() [ Short URLs: https://wind-watch.org/doc/?p=4923 | http://wndfo.net/D4923 ]
[ Short URLs: https://wind-watch.org/doc/?p=4923 | http://wndfo.net/D4923 ]
Tags: Wind power, Wind energy
