‘Bad science’ behind the wind turbine noise guidelines
Cox, Richard; and Unwin, David
With contributions by Doug Bingham and Rod Greenough. Prepared for possible presentation to DECC, March 2013.
The term ‘Bad Science’ is borrowed from the title of the book by Ben Goldacre (ISBN 978‐0‐00‐728487‐0). Although his book relates to medicine and the pharmaceutical industry, the lessons regarding bad science are equally applicable to the wind power industry.
This presentation identifies the ‘Bad Science’ that is being used throughout the noise assessment process. Since the 1990s ‘Bad Science’ has been incrementally applied to the wind turbine noise assessment guidance such that it is now firmly enshrined in what is promoted by the wind industry as ‘industry best practice’.
The end result is that it has allowed wind turbines to be built too close to residential areas resulting in an increasing amount of noise nuisance and the probability of increasing numbers of noise related complaints.
This presentation and supporting material looks at the science behind the noise assessment process. We demonstrate that the key principles supporting the current ETSU guidance are unreliable and the levels of uncertainty are sufficiently large that an ETSU based noise assessment provides no assurance that noise will not become a problem for people living close to wind turbines.
We believe that only by enforcing a minimum separation distance, (typically in the order of 2km for the current generation of industrial wind turbines) can a reasonable degree of protection be provided against noise nuisance.
Only a limited selection of the ‘key issues’ topics can be presented during this presentation, but we have assembled and made available via ‘Dropbox’ links a considerable amount of support materials.
[Of note, see ‘Neglect of Wind Shear in Assessing Long Range Propagation of Wind Turbine Noise [1]’ by Mike Toft]
We are a loosely connected group of mostly retired scientists and engineers spawned from wind farm opposition groups across the country. Characteristics common to all include:
We are aiming this presentation material at the DECC Chief Scientific Officer, David Mackay, since we note from the DECC web site that his first listed responsibility is: “Making sure key policy and planning decisions in DECC are evidence‐based”.
We identify the main areas where the evidence shows that ‘Bad Science’ is being routinely employed in the noise assessment process and that in turn this is having an adverse effect on the planning process for wind energy developments.
We refer here to the Institute of Acoustics (IoA) Noise Working Group (NWG) and the wind turbine noise assessment guidelines currently being prepared by this group for the Department of Energy and Climate Change (DECC).
A cynic might well believe that ETSU‐R‐97 was produced to permit the introduction of wind farms into inappropriate low background noise locations where they and other comparable industrial installations could not meet planning conditions derived from the long established BS 4142.
We will argue that noise assessments based on the long‐standing BS 4142 Standard provide a more robust methodology than ETSU.
The Acoustics Bulletin method, now incorporated into the IoA NWG draft guidance, provides a new methodology for correcting for wind shear. It will be shown later that this new methodology is unsafe and when compared with the original intentions in ETSU allows even higher noise levels and reduced separation distances.
This presentation builds on the content from a document two of us were involved with that has been widely circulated: ‘Where ETSU Is Silent’ [2] (WEIS).
The IoA-led consultation launched during July 2012 is an attempt to update the guidance based on ETSU‐R‐97 [ref 13]. A major concern with the IoA NWG consultation process is the lack of transparency and potential conflict of interest with the NWG dominated by the wind industry supply chain. See WEIS [ref 3] page 11 and Appendix D.
Several consultation responses (that we are now aware of) have not been published and those that are published are done so anonymously [ref 17 & 18]. The Ref 17 and 18 documents are the published consultation responses and were obtained from the IoA web site.
Also see:
It took 5 months for DECC to provide a response ref 9 to a letter from Chris Heaton-Harris MP (Con., Daventry) regarding the report ‘Where ETSU Is Silent’ [ref 3] by Cox, Unwin and Sherman.
Although WEIS identified numerous areas where ETSU fails to provide adequate guidance (is silent), Ed Davey (DECC) only commented on wind induced noise. We will discuss wind induced noise later and show that the report referred to by Ed Davey, ‘ETSU W/13/003861REP’, has been quoted totally out of context, demonstrating ‘Bad Science’ at its worst.
Other issues, including wind shear, background noise data analysis, turbine noise prediction, amplitude modulation and assessment uncertainties, were glossed over as being addressed by the new IoA ‘good practice guide’.
This is the basic 5-step ETSU noise assessment process:
The ETSU assessment process revolves around these core principles:
However, when we examine the science behind the noise assessment process we demonstrate that each of these core principles is shown to be unreliable such that the guidance fails to provide adequate protection for receptors against wind turbine noise.
When looking at the ETSU process we should also look at BS 4142 from which ETSU evolved.
BS 4142 is titled, ‘Rating industrial noise affecting mixed residential and industrial areas’. Without getting into detail, the critical advantage in using BS 4142 is that it enables local authorities to exercise duty of care responsibilities.
Regarding BS 4142 [ref 2] we should also add:
Overall, BS 4142 provides enforceable, robust noise assessment guidance.
ETSU‐R‐97 is titled, ‘The assessment and rating of noise from wind turbines’.
The critical factor is that ETSU prevents local authorities from exercising duty of care responsibilities.
We should also add:
The failings of ETSU are currently requiring the production of a new Good Practice Guide produced by the IoA NWG whose composition includes several representatives of acoustics consultants companies that regularly represent wind farm developers at public inquiries and in no sense can be regarded as truly disinterested.
Under the heading of ‘merits’ one could argue that ETSU has considerable merit over BS 4142 for wind farm developers.
We will now review the main areas of ETSU and the IoA draft guidelines, designated as planks A, B and C.
Plank A: Estimation of existing background noise levels at nearest receptors, for all generating conditions at the proposed turbines, leading to appropriate noise limits at receptors.
Plank B: Prediction of turbine noise propagation to nearest receptors, for all generating conditions at the turbines, leading to determination of compliance with limits.
Plank C: Comparisons of measured and predicted to produce an overall noise assessment.
Planks A and B directly relating to the assessment process are fraught with difficulty and Plank C issues highlight fundamental overall faults and uncertainties.
As a result we believe that the current draft guidelines from the NWG reveal a fundamentally flawed, unsound scientific approach in all areas.
The draft guidelines do not, therefore, in our view form a suitable starting point for wider consultation.
Measurement Location
Free field or facade? Common sense says ‘facade’ as this is where residents will experience the noise but the guidelines say ‘free field’. What’s the difference? Background can be around 3dB lower at the facade due to screening and turbine noise can be 3dB higher due to reflection. This yields up to a 6dB difference within the assessment.
Why measure background noise at 1.2 to 1.5m height and not at ground level where we could minimise wind induced noise as is the case for measuring turbine noise? Where is the science to justify this measuring height?
Microphone Wind-Induced Noise
Directional Screening
The guidance fails to recognise the importance for this or to provide for a robust directional screening process. It is particularly important for sites near motorways and major roads.
Poor Statistical Science
We see widespread misuse of statistical regression analysis and a failure by decision makers to question or even understand the analysis. This allows a misuse of science providing developers the opportunity to steal 2 or 3dB extra to noise limits. This is ‘Bad Science’ being employed to confuse decision makers.
Wind Shear Correction
The wind shear correction methodology being proposed by the IoA NWG is another case of ‘Bad Science’. It is too complex and will be incomprehensible to planning decision makers. In fact we are finding that this methodology is proving to be extremely difficult to understand for anyone who has not themselves analysed wind shear using raw mast wind speed data. In fact we doubt that all the members of the IoA NWG themselves actually understand it!
What on first impression looks like an elegant solution to wind shear correction turns out in practice to fail to provide receptors the protection required and is overly complex. There is no doubt it offers a clean solution for developers by reducing operational risk from noise complaints.
Noise Prediction
Wind shear also plays an major role in the propagation and intensity of outdoor noise through its effect via refraction. The science behind this has been well know since the 19th century but is not considered by the current guidance or by developers when wind turbine noise is predicted. It is therefore not surprising that turbine noise is being under predicted resulting in an increase in noise complaints.
Wind turbine noise prediction is normally carried out using the standard ISO 9613‐2. However, this standard was designed for low height, non–wind-dependent stationary noise sources where wind shear and wake effects are never a significant factor. This standard has never been validated for use with modern tall wind turbines in high wind shear conditions.
The three studies referenced in the IoA NWG document fail to consider wind shear or wake effects. All three studies appear scientifically unsound and none of them have been published in a peer‐reviewed journal. None of them appear appropriate as fundamental references for DECC and IoA endorsed guidelines. Another case of ‘Bad Science’. We understand that Dr Mike Tolft will be making a separate representation where he will discuss this particular issue. However, his IoA consultation response [ref 17 starting at page 127] provides further detail on this topic.
Amplitude Modulation
AM is the most important noise characteristic of wind turbines so excluding it from the IoA NWG review of the guidelines must be of concern to anyone of a scientific mind. We find it difficult to understand why AM is apparently such a mystery to the wind power industry.
Almost certainly turbine manufacturers will understand the problem in some detail since it is virtually identical to helicopter blade vortex interaction (BVI) or ‘blade slap’. However, no turbine manufacturer would dare to admit openly to excess AM so the phenomenon stays hidden and the wind industry pretends it is not an issue. However what causes helicopter BVI, and how to minimise it has been well understood for decades.
Additionally, the standard planning condition based on dB LA90 is ineffective at controlling excess AM. The Den Brook AM planning condition based on dBLAEQ 125ms will detect excess AM. However, the wind industry is desperate to have the Den Brook condition removed from general use and more ‘Bad Science’ is being deployed to discredit this condition. Not so much a case of ‘bad science’ as one of ‘no science’.
Noise Limits
Noise limits and the ill health effects of turbine noise are excluded from the IoA terms of reference provided by DECC and WHO noise limits are also being ignored – Why?
There is no evidence of medical or audiology experts having been consulted to ensure that the limits we do have are scientifically derived.
How can robust guidance based on scientific principals be produced if noise limits and health effects are excluded?
Low-Frequency Noise (LFN)
The existence of significant levels of LFN has been consistently denied by the wind power industry and Government. However recent evidence [ref 7] has shown significant levels of LFN being measured inside homes located near turbines and that LFN is directly affecting the health of residents. In many case residents have had to abandon their homes.
These adverse effects are related to the extremely low frequency pulsations at the blade passing frequency. The rotational speeds of modern turbines having 80m and 90m diameter rotors are occurring at the known peak frequency for causing these effects known as nauseogenicity.
A most significant finding is that residents are being affected where the turbine noise is either not audible or barely audible at all. This has highlighted the need for new definition for a ‘threshold of perception’ and dispels the ETSU core principles that noise nuisance is related to the noise we hear and that background noise can mask the effects of turbine noise.
LFN is ‘the elephant in the room’ for the wind power industry and demands urgent Government action. During Feb 2013 it was announced that the South Australian Environment Protection Authority has said it will conduct full spectrum monitoring, inside and outside homes, due to concerns regarding LFN. Similar action is also being taken by the Government of Ontario, Canada.
Assessment Uncertainties
Neither ETSU nor the NWG draft guidance recognise uncertainties, also referred to as tolerances. This must make wind turbine noise assessment the only exact science, other than hindsight.
Each step of the assessment process is subject to uncertainties, some adding and some subtracting and varying according to different operational conditions. However, if we combine these in a conservative yet scientific manner we easily can expect noise levels that are either twice or half as loud as predicted Given that wind farms are being designed up to the noise limits with headroom usually less than 3dB and frequently less than 1dB, it is easy to see how limits can be exceeded and why there is a high chance of noise complaints with such levels of uncertainty. This is another case on ‘Bad Science’.
Considering plank A and plank B it is generally safe to say that:
It is in the interests of developers for:
Higher noise limits allow reduced separation distances and reduced generation constraints for developers
Most assessments we have seen claim ETSU compliance by the smallest of margins (typically less than 3dB and sometimes less than 1dB) as wind farms are being designed and consented (usually at appeal) right up to the noise limits.
Measurement Location
BS 4142 page 2 sect 5.3 states:
“Choose measurement positions that are outside buildings and that will give results that are representative of the specific noise level and background noise level at the buildings where people are likely to be affected.”
BS 4142 page 2 sect 5.3 note 2 states:
“Where it is necessary to make measurements above ground floor level, chose a position which is 1m from the facade on the relevant floor of the building.”
This requirement would typically apply to noise levels affecting a first floor bedroom.
ETSU requires measurements 10m from the facade – Why so far away?
NWG draft suggests 3.5m to 10m – Why so far away?
Why Location Is Important
Turbine noise is from a specific point source whereas background noise is coming from all directions, including vertically.
Measurement location should be selected to represent as close as possible the noise environment experienced by the residents.
The differences between free field and facade may be up to 6dB.
A free‐field measurement is clearly to the advantage of the wind farm developer as it allows a higher background noise to be measured and so a higher noise limit to be established.
Measurement Height
Measurement height was questioned during the IoA consultation workshop and no one present could provide a proper answer as to why 1.2–1.5m height was used, other than it was copied over from BS 4142. A case of “We always do it this way”.
It should be noted that BS 4142 does not intend measurements to be taken in wind speeds above 5m/s so a microphone height of 1.2 to 1.5m should not in these situations cause problems with wind induced noise.
Measuring background noise with the microphone at ground level as employed for measuring turbine noise would eliminate wind-induced noise at the microphone. Page 11 section 5 of IEC 61400 states, “Measurements are taken with a microphone positioned on a board placed on the ground to reduce the wind noise generated at the microphone and to minimise the influence of different ground types.” Note that when using a ground board as per IEC 61400 (sect 8.3) then it is necessary to subtract 6dB from the measured value to account for the reflective effect of the ground board.
IEC 61400 [ref 19] is a highly detailed standard designed to ensure clarity between turbine developer and manufacturer whereas the ETSU guidance for background noise measurement is unscientific and vague.
Microphone Wind-Induced Noise
Microphone wind-induced noise has the effect of increasing the measured noise. ETSU-R-97 warns of the problem, but subsequently ignores it. BS 4142-1997 [ref 3] warns of the problem and advises:
BS 4142 page 2 sect 5.4 refers where it also states: “Use an effective windshield to minimise turbulence at the microphone.”
Detailed comments to the ETSU report W/13/00386/REP are provided in the response to the IoA consultation [ref 14] by R Cox.
The original report as presented was a reasonable attempt better to understand the problems of wind induced noise but basically it was inconclusive and recommended further research. It does not provide a specification for a proven wind screen design. However, the report has since been quoted completely out of context in ETSU‐R‐97 and elsewhere. Until last year the report was generally unavailable so as a result until quite recently no one has questioned it.
The statement by Ed Davey MP in his letter to Chris Heaton‐Harris MP (Con. Daventry) dated 16 Dec 2012 [ref 9] is therefore completely wrong where he states: “which includes a design for suitable double layer wind shields”. It does not.
The Rion WS‐03 is one of the most widely used windscreens for wind farm background noise measurement and has a similar performance to the Rion WS‐15. These are probably the best commercially available wind screens. Even so they have severe limitations to their use in wind speeds above 5m/sec.
This analysis was conducted by Dr Greenough:
 [3]
[3]
Wind speeds shown in the slide at ten metres height have been adjusted to compensate for the lower wind speeds at 1.5m above ground level where the microphone would be located. This graph shows that the performance of wind screens available from several manufacturers are quite similar and all produce similar levels of wind-induced noise.
The best wind screens currently being used suffer around 40dB(A) wind induced noise at 5m/s. This adds a degree of uncertainty to the assessment process that even recent comparison studies have failed to quantify.
In fact, the only studies conducted recently have been comparisons. None have been able to quantify the actual level of data contamination.
Directional Screening
This is becoming more of an issue for wind farms as they are often located near motorways and trunk roads for ease of access for the heavy loads. Road traffic leads to highly variable levels of background noise depending upon traffic flows and wind direction.
The range of data points typically seen of >20dB was also observed by Bass, Bullmore and Sloth [ref 12] during their 1996 to 1998 study where they state at page 8, para 3.1:
“an unexpected feature of the background noise data at all sites was the large variation of the results between monitoring locations. A spread of almost 20dB(A) was apparent between the mean levels at each of the monitoring locations on each site over the wind speed range from 5m/s to 8m/s. This was even the case for the flat topography site where all monitoring locations were exposed to what should have been identical conditions. This finding has implications with regard to background noise measurements undertaken to assess the acceptable levels of specific noise radiation from wind farms. Users of any technique that sets wind farm noise levels relative to measured background noise levels should be aware of the differences between measurements. Further work is suggested to establish whether the large measured differences are real changes in background noise level or whether they are due to the differing susceptibility of individual items of measuring equipment to wind induced noise.”
This slide shows a typical case where motorway noise has a major effect on background noise (as any local resident knows) depending upon wind direction and traffic flow:
 [4]
[4]
Without directional screening the derived background noise level will be much too high for the worst case situation of northerly to easterly winds.
For obvious reasons, wind farm developers have generally resisted directional screening of background noise data whereas the evidence shows wind direction is a very important factor in background noise levels and subsequent noise nuisance.
A robust directional screening would result in two or more sets of background noise data and noise limits that would be dependant upon wind direction.
The new draft guidance is unclear regarding the requirement and lacks a process to ensure robust screening for directional effects.
How ETSU recommends that the data should be used in the assessment
ETSU‐R‐97 compares the measured ‘background’ noise with that predicted for the turbines over a range of wind speeds.
There are scientific problems in how the background data are processed to arrive at summary measures that can be compared with the turbine noise prediction.
There are also problems in how the background data are processed to arrive at summary measures that can be compared with the turbine noise prediction.
This is all that ETSU-R-97 (page 101) says about how the combination of the data is to be achieved:
“For each sub-set, a ‘best fit’ curve should be fitted to the data using a least squares approach usually a polynomial model (of no more than 4th order) … These two curves, referred to as the ‘day-time curve’ and the ‘night-time curve’, provide a characterisation of the prevailing background noise level for day-and-night respectively, as function of wind speed from zero to 12m/s at 10m height. Note that whatever model is used to describe the measured data, this should not be extrapolated outside the range of the measured wind speed data.”
ETSU suggests that the best way to summarise the background is to plot the measured value of noise against wind speed (10m AGL) and then draw a ‘best fit’ curve through these data.
No physical reasoning is put forward to guide the choice of curve to be fitted but the examples given are all polynomials of order up to order 4 (quartic).
Three features need to be noted.
Issue 1: Implicit assumptions
ETSU’s approach prioritises the impact of wind speed on the noise climate.
Issue 2: Problems with the data
In practice cubic or quartic polynomials are usually used. The objective seems to be to get a ‘good fit’ to the data, using the coefficient of determination, R², as the sole criterion of fit, but
This curve-fitting procedure, using classical regression, that has been known and used since the mid‐nineteenth century, assumes that the data are an independent random sample from a defined population of possible values.
The method evolved when, rather than being a very large data file downloaded from an automatic recording device, each and every data point was likely to be hard won by careful hand measurement.
Autocorrelation can be understood by a simple thought experiment. Suppose that at some time the anemometer records a V₁₀ wind speed of 10m/s, what is the value likely to be in ten minutes time? Given that meteorological elements show persistence in time it is highly unlikely to be either 0m/s or, say, 25m/s? Chances are that it will be fairly close to 10 m/s. In other words successive data are correlated with themselves. Yet statistical inference assumes that each case is independent or uncorrelated with the others.
The effect on the result is to bias the standard error because the standard goodness of fit measures are ‘tricked’ into believing that there is a larger sample than actually exists. Larger samples give smaller standard errors and better statistical significance and thus an illusion of accuracy that isn’t actually present.
Issue 3: Any function will do?
In practice the noise assessment reports we have seen fit quadratic, cubic or quartic functions in the hope of getting some ‘best fit’ as measured by the coefficient of determination given in an ordinary least squares fit.
Any of these curves could have been used in a noise assessment and all fit the data reasonably well. Since there is no science to guide our choice any one of them will do the intended job BUT, quite critically, the result is a range of possible ‘summary’ values at each whole number wind speed.
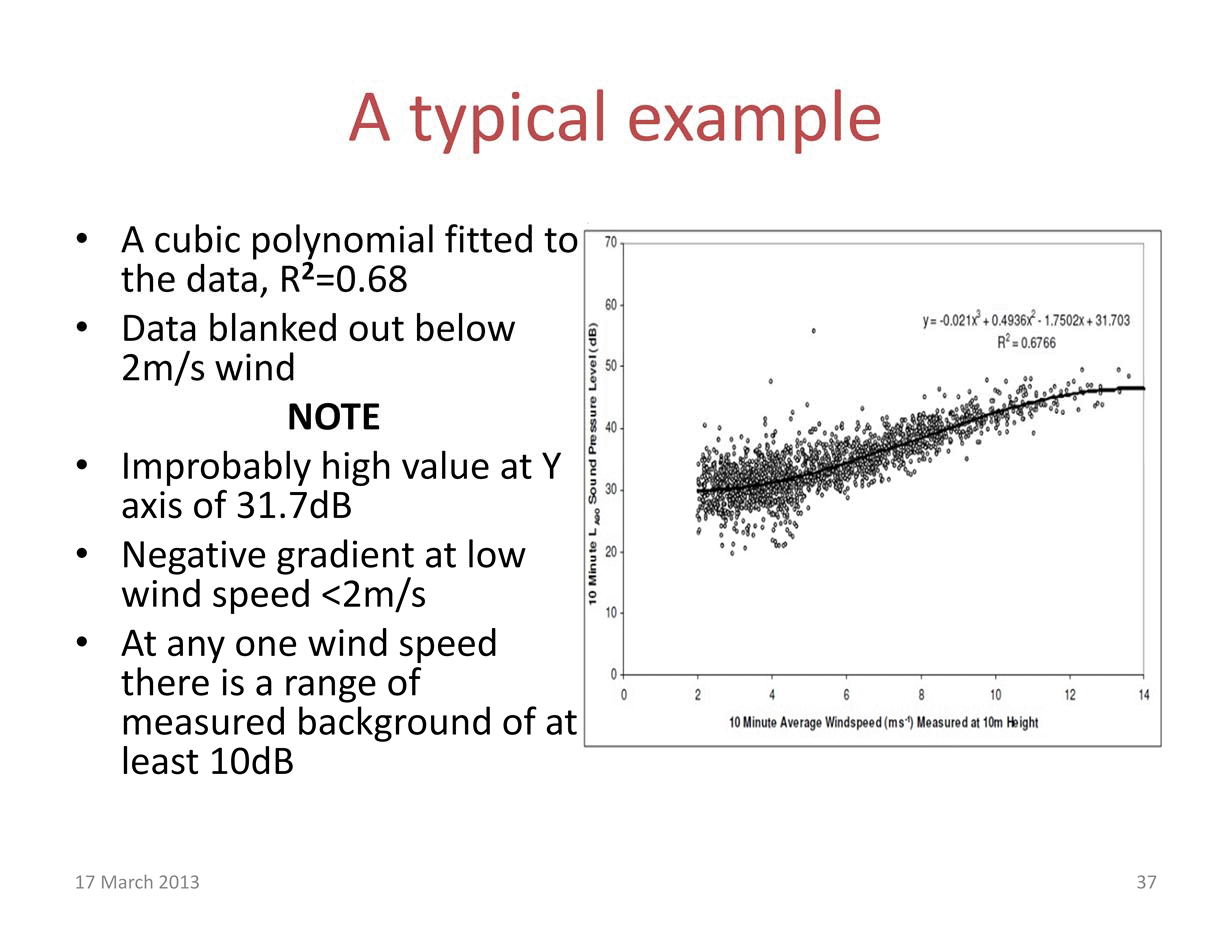 [5]
[5]
These are real data accepted and used to set noise conditions at a recent wind farm inquiry. They are typical and the summary they suggest was used in the assessment process by the planning inspectorate, an action justified by the notion that the analysis was conducted properly since it followed the ETSU guidance.
Does It Matter?
We are seeing consents given with ‘headroom’ <0.5dB!, in effect treating the entire ETSU process as totally deterministic and subject to no error or uncertainty, which is scientifically crazy.
There are alternatives of which we have investigated two in detail:
 [6]
[6]
On the left we have simply binned the data (these are simulated data: most of the real data available are not in the public domain) at each whole number wind speed and for each drawn a ‘boxplot’ to show the median, inter‐quartile range and total range at that wind speed ±0.5m/s. ETSU actually suggests that this approach might be used but for some reason the industry of acoustics consultants who appear for developers seem to have quietly ignored this recommendation. It has two advantages. First, no curve is fitted – we rely solely on a summary of the measured data (plus a bit on the bins chosen). Second, it makes explicit the fact that at each wind speed we have a range of background that might, or might not, mask any turbine generated noise.
The curve on the right hand side has been fitted to the same data but with a constraint that as it intersects the Y axis it has zero gradient – this is a simple logical constraint that must be true. In a real example where we have done this we find that the fit is only marginally reduced and the predictions of the noise climate are more consistent at all the receptors than you get from the standard unconstrained approach.
See ref 11, for more detail. This paper has been submitted to the Institute of Acoustics and will be published in the Acoustics Bulletin May 2013 edition. Its findings were made available to the IoA NWG consultation but almost certainly will be ignored.
We have thus far assumed that the predicted turbine noise levels at each and every receptor is reasonable. The next series of slides show that this is simply not the case. There are three critical issues:
Handling Wind Shear
ETSU makes only minimal reference to wind shear. The loA Bulletin, March 2009 [ref 5] was an attempt to clarify the treatment of wind shear, which we believe:
The IoA NWG draft document [ref 13] attempts to formalise the IoA Bulletin Method into the new guidance.
This slide taken from WEIS [ref 3] shows a plot of wind shear for the Winwick site in Northamptonshire over a typical 7-day period showing how highly variable wind shear can be in the short term:
 [7]
[7]
The horizontal axis is time based, the numbers relate to the 10min data sets over the 7-day period. The vertical axis is the shear exponent. The shear exponent is a simple plot of log(ten minute mean wind speed) vs. log(height AGL). In effect the magnitude of the exponent provides an index of how rapidly wind speed changes with height AGL, which is the major part of the wind shear (it neglects directional change) that more properly should be included). Note that shear goes negative on occasions, indicating a reduction in wind speed as one ascends. This is found to occur at very low wind speeds in stable atmospheres and may well indicate the presence of low level jet flow.
Despite this apparent random behaviour, over the long term the shear profile is regarded as being very reliable and predictable year after year. This is why wind farm developers record wind data for at least a year in order to determine the wind resource for the site.
 [8]
[8]
The average wind shear throughout the 12 month period for this site (Winwick) calculated from 51,943 valid 10 minute data sets was found to be 0.2548. However, plotting the average hourly wind shear (for the 12 month period) shows typical diurnal variation, with a minimum value of 0.11 occurring around mid‐day and a maximum value of 0.32 occurring around midnight. There is thus a very large daily variation by a factor of around 3.
For reference in the literature, shear exponents above 0.5 are generally regarded to indicate ‘excessive’ levels and are known to be associated with excess amplitude modulation (see later).
If you refer to Figure 6 at WEIS reproduced here you will see a breakdown of hourly shear into (vertical) bands based on percentage of time. Note this relates to 12 months worth of data for the Winwick wind farm site:
 [9]
[9]
Also in the analysis of Winwick, the data sets with V80 wind speeds below 4m/s (when the turbine would not be generating) were removed to prevent the extreme but nonrelevant shear values from corrupting the analysis. It should be clear from this slide that correcting for ‘average’ shear will under‐correct for the significant percent of the time when shear is very high and when noise complaints are most likely to occur. Analysis of the data for this site to determine the durations for shear levels during each hourly period shows:
To see the effect of wind speed, on wind shear (WEIS fig B4 at page 73) produced by Prof D Unwin shows a funnel plot of shear v wind speed. High shear only occurs at the lower to mid‐range wind speeds and this is where noise nuisance is most likely to occur. On the plot ‘alpha’ is the shear exponent, established by over 50,000 regression analyses of the 10‐minute wind averages at the same site.
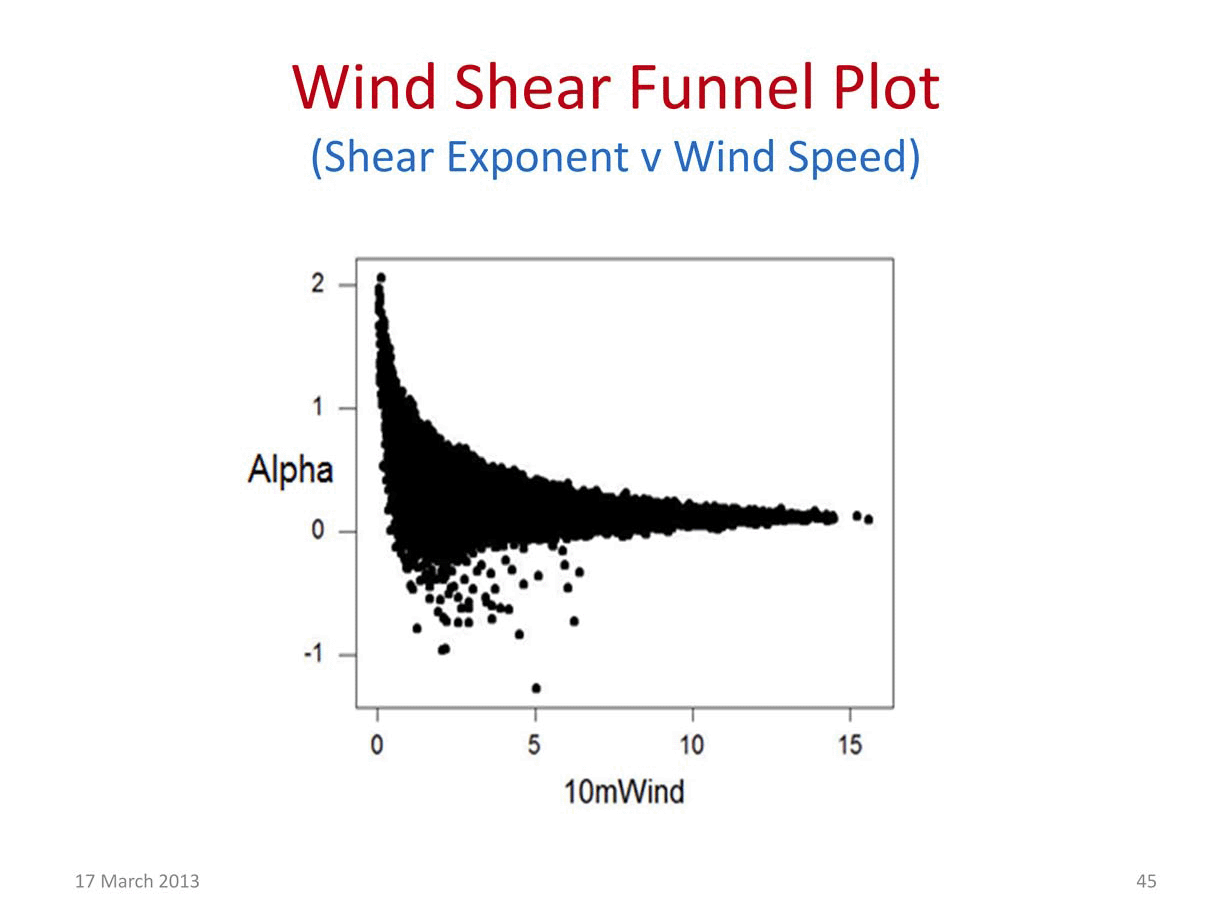 [10]
[10]
Some features of the plot should be pointed out:
 [11]
[11]
We show on this slide some other sites where data has been analysed by the authors and others. Some sites show even higher levels of wind shear than is shown for Winwick.
Although the years for which there is available data vary, these wind shear calculations are based on a consistent regression‐based methodology applied to long term mast data. They show the percentages of time during the day when shear is within the bands shown. Note that 0.16 is the ‘standard’ level of shear exponent. What these numbers do not show (but the slide 2 previous does) is that the higher levels of shear occur mostly during the evening and night time hours so contribute to noise nuisance during these hours.
Harrington, Kelmarsh and Winwick are located in Northamptonshire, Den Brook in Devon and Shipdham in Lincolnshire. We can conclude from this data that high levels of shear where the exponent exceeds 0.5 occur for probably more than 10% of the time at most wind farm sites. The view put forward by the industry that high shear is confined to low lying flat land is simply incorrect.
Note: Data for Den Brook and Shipdham provided by REF.
Wind Shear Correction
Main concerns with the wind shear correction methodologies:
These concerns relate to both the NWG draft document [ref 13] and the IoA Bulletin article [ref 5] dated 2009 from which it was developed.
Unfortunately, the NWG proposed shear methodology is quite complex making it extremely difficult to understand. It is doubtful if all members of the IoA NWG fully understand it and our experience to date is that only those who have conducted detailed analysis of raw mast data are able to appreciate fully the true implications of this methodology. It will most likely be incomprehensible to planning decision makers.
In theory, correcting for wind shear either by adjusting the measured background noise or the predicted turbine noise should produce the same assessment result. The IoA document at Annex E Para 7.5 confirms that either of these two methods will work. However, it is how the shear correction is implemented that generates problems, with the devil being very much in the detail. In fact we believe that only one method of adjusting the turbine noise level for wind shear can be made to work as ETSU originally intended.
The 1st bullet point at annex E para 7.5 [ref 13] provides the cleanest and most ‘transparent’ method of shear correction, i.e. correcting the predicted noise curve for shear. This is also the most logical method from the point of view of a person on the ground since wind shear affects the turbine noise not the background noise. This method is sometimes referred to as the ‘ETSU method’. The noise limits produced by this method are based on the actual background noise levels at a particular receptor (residence) location with the actual wind speed at 10m AGL at the wind farm site as the reference point. The actual 10m wind speed at the receptor is likely to be more closely correlated with the site 10m height wind speed than to hub height wind speed. If the limits are subsequently breached it is most likely because wind shear has caused the turbine noise to be louder that was predicted.
This is the method described in WEIS and is demonstrated at the next slide. So as regards to the effectiveness of this method we are in agreement with the IoA NWG, but note that the NWG (para 2.4.5) are only intending that it be used with small (<500kW) turbines.
The second method was previously referred to as the ‘Bulletin method’. In this case the noise limits are based on using hub height wind speed as the reference level. Background noise levels at the receptor location are corrected for instantaneous shear during the background noise survey period and recorded against standardised 10m AGHL wind speed, calculated from hub height wind speed using the ‘standard’ 0.16 shear exponent. An average line is then taken through these data points to determine the reference background noise.
As we have seen wind shear is highly variable in the short term (days and weeks) but over a longer period such as a year the overall shear profile is considered to be highly consistent and repeatable year after year. It is for this reason that developers measure a site’s wind resource over typically a 12-month period. Establishing the shear profile is a fundamental part of the developer’s wind resource calculations.
If we base the noise limits on the short term shear measurements obtained during a (typically 2- or 3-week) background noise survey then there will be a high risk of sampling error. Additionally, the noise limits will not relate to the actual site 10m AGL wind speeds. At the planning stage it therefore becomes very difficult to assess whether a noise breach is likely to occur. In the event of any later noise complaints, it will be very difficult to determine whether a breach of the limits has occurred and will require close cooperation by the turbine operator since hub height wind speed data are required to determine if a breach has occurred.
 [12]
[12]
This slide shows what we believe to be the preferable wind shear correction methodology, known as the ‘ETSU method’ but only providing the appropriate amount of shear correction is applied. The correction is applied by offsetting the predicted turbine noise curve to the left for shear in excess of the standard (0.16 exponent). This is described in WEIS.
This method can provide a limit based on the high level of wind shear that may occur at a particular site for what is considered a significant percentage of the time. To achieve this it is likely that an offset of greater than 3m/s would be required for most wind farm sites.
Unfortunately the NWG have steered their methodology to the alternate method in virtually all cases (except turbines of <500kW) by applying the correction to the background noise data. The problems associated with this NWG methodology have been demonstrated by Moroney [ref 6].
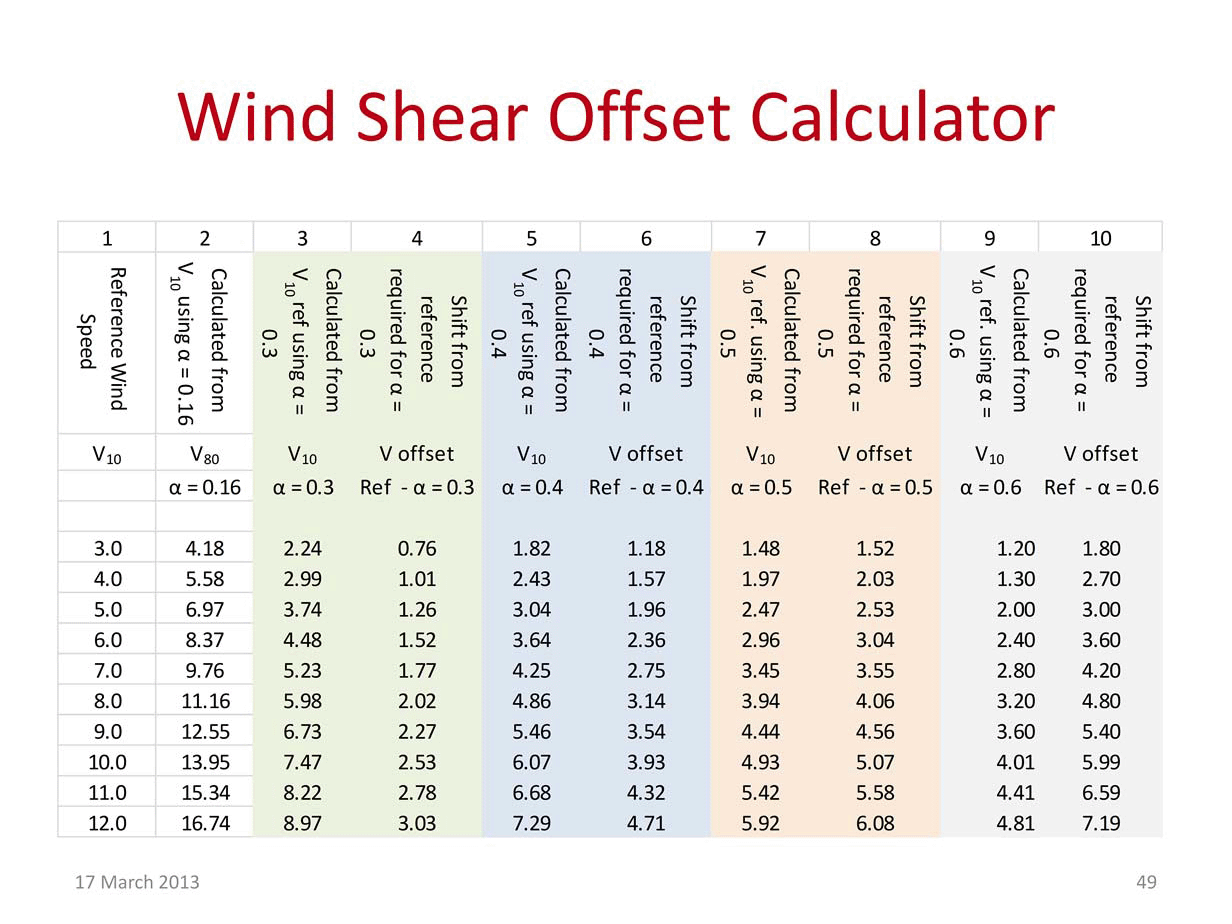 [13]
[13]
This slide taken from WEIS Table 2 shows the levels of shear offset that are required for a range of wind speeds and shear exponents. The offset required is the difference between the standardised 10m wind speed (column 1) and the actual 10m wind speed at the required shear exponent (columns 3, 5, 7 & 9). The offsets are given at columns 4, 6, 8 & 10.
For example, at a 10m wind speed of 6m/s and a shear exponent of 0.5, the actual 10m wind speed would be 2.96m/s requiring an offset of 3.04m/s.
The next few slides demonstrate the problems associated with the second method being proposed by the IoA NWG. REF (Moroney) [ref 6] demonstrates the effect of the this second (Bulletin) method on the background noise data plots and it is a simplified version that is shown here.
 [14]
[14]
The slides shows a starting point with a cleaned up background noise curve (dB(A) against measured 10m AGL wind speed. The blue line is a typical curve for averaged background noise as measured at rural sites obtained during a 2 to 3 week survey period and for clarity the blue data points have all been removed. No shear correction has been applied to this line.
In applying the IoA NWG methodology we derive from the anemometry data the ‘standardised’ 10m AGL. We find this method introduces a high degree of scatter reducing the accuracy on the derived noise limit. The red dots are the same background noise data points but now plotted against the IoA NWG method’s ‘standardised’ wind speed. The substantial increase in scatter is a direct result of this methodology as each is corrected for instantaneous wind shear.
What is immediately obvious is that the IoA NWG method’s transformation moves most of the background noise points under the original blue line; (this is expected if actual shear is greater than the standard 0.16), and that the degree to which the points drop depends on the value of wind shear being applied. The data points are effectively offset to the right. These data cover a two week period that includes some periods of relatively high wind shear, so there are many points significantly lower than the simple ETSU line of background noise versus actual 10-metre wind speed. It may be noted that at higher wind speeds the shift of the red points from the blue points is much smaller; this is because wind shear tends to decrease at higher wind speeds.
The next step in deriving a background noise condition according to the IoA NWG methodology requires fitting a smooth polynomial to the transformed data, effectively averaging out the data. However, what is also clear from this slide is that the IoA NWG’s method’s transformation results in an asymmetrical distribution of red points which a polynomial is unlikely to fit well. The critical wind speed range (where noise nuisance is most likely to occur) of 5–8m/s is particularly poorly represented by the polynomial with a third of the background noise data points being 4dB or more beneath the line.
 [15]
[15]
Furthermore, at the lowest and highest wind speeds, the polynomial fits the data particularly poorly. This demonstrates that shear was very high for a significant percentage of the time and higher than apparent due to the averaging effect of the polynomial curve. These results show that the transformation proposed by the IoA NWG’s authors to account for wind shear results in a poorer fit with more scatter.
The figures show what is intuitively understandable, namely that background noise at a neighbouring dwelling is not closely related to, or dependent on, hub height wind speeds – particularly in the wind speed range of 0–8m/s. Crucially, it follows that any noise condition based on this fit will be less reliable than one based on the original ETSU method. In order to protect against the highest levels of wind shear it could be argued that the line should have less than 10% of the red dots below it. To achieve this it would need to run almost horizontal from zero wind speed to around 7m/s where it would then curve upwards.
Another major problem with using the IoA NWG’s methodology is that the resulting noise condition limits vary significantly depending on the particular wind shear that occurred during the background noise baseline survey, leading to a high risk of sampling error.
This is demonstrated in these two diagrams which show that if monitoring was carried out over two different fortnights two weeks apart in 2008, the IoA NWG’s method’s transformation shifts the average background noise data in a significantly different manner:
 [16]
[16]
However, once the limits are set they would apply under all conditions.
To summarise wind shear correction:
The key problem with the NWG methodology is that the averaged (derived) background noise curve from the corrected data points will be too high. A secondary problem is that short survey durations will result in a high risk of collecting unrepresentative data with regard to the long term shear profile.
The real issues here is not whether correction should be to the background or turbine noise data, or whether wind speeds are referenced to 10m height or hub height, what needs to be considered is how to provide reasonable noise protection for receptors in a transparent way such that planning decision makers can easily understand it and to give noise limits that in practice can be enforced by Environmental Health Officers acting for the local planning authority.
A reasonable level of protection will not be achieved using any average shear correction or even based on ±1 standard deviation of the distribution of corrections.
We conclude that the methodology being promoted by the IoA NWG fails to provide the promised levels of protection, opening the way to a prospect of enormously complex future legal difficulties.
A detailed description of the effects of wind shear on noise propagation and ISO9613‐2 is provided by Dr Mike Tolft in his IoA consultation response [ref 17 starting page 127]. The next two slides provide a summary of his argument.
Wind shear is the condition where wind speed varies with height above ground level. The normal atmospheric condition is one of positive wind shear, where wind speed increases with height. Discussion of wind shear is usually confined to the problem of causing differences between wind speed at different heights and the implications for sound power generated at the turbine and background noise generated at ground level.
A completely different and if not more important aspect of wind shear is its role in determining, via refraction, the propagation path and intensity of outdoor noise. The role of wind shear in outdoor sound propagation has been well understood since the founding work of Stokes, Reynolds and Rayleigh in the 19th century, and yet full discussion of the effect of wind shear appears to be totally neglected in wind farm noise assessments.
Wind shear shapes the propagation paths of outdoor noise in all directions, strongly affecting the intensity of sound at receiving locations. Wind shear is a principal cause of noise levels being often unexpectedly enhanced at locations a long way downwind of a noise source. Whilst ISO 9613‐2 implicitly takes some account of this effect of wind shear on propagation from low height, non‐wind‐dependent stationary sources, by means of ground attenuation (Agr empirically determined) under downwind conditions, the degree of wind shear accounted for is not made clear within the standard.
Motorway noise provides a useful everyday example of noise propagation. If you stand immediately next to a motorway when the wind is blowing across it, it doesn’t matter which side you stand on, upwind or downwind, the noise levels will be essentially the same.
If you walk away from the motorway on the upwind side, i.e. walking into the wind, the noise levels will drop off quite rapidly. This is not true of walking away on the downwind side, noise will persist at significant levels for many hundreds of meters.
It’s as if the wind blows the sound along – but this is in fact not the case at all, this is the crucial point.
Were there to be a 25 mph gale blowing across the motorway, with the same wind speed at all heights above the ground, the motorway would be equally noisy at long distances upwind as downwind; this is an unexpected conclusion and not our normal experience at all. However it would occur in such a situation of zero wind shear.
It would happen because the speed of sound in air is around 768mph, so movement of all the air at 25mph one way or the other will have very little effect.
In practice the wind is generally stronger at greater heights, which progressively changes the speed of sound with height; this in turn changes the curvature of the wave fronts and hence the direction of their propagation.
Sound waves consequently bend back down to earth on the downwind side at longer distances from the source; the opposite happens on the upwind side.
This gives us our everyday experience of motorway noise being enhanced at long distances downwind.
Further to these observations, were there to exist a condition of negative wind shear, such as might pertain above a low‐level atmospheric jet, then sound propagation would actually be enhanced in the up‐wind, rather than the down‐wind direction, which is entirely counter‐intuitive, emphasising that sound is not ‘blown along by the wind’.
Wind shear thus plays a major role in determining noise impact at longer range from turbines, but this is not given explicit consideration by wind farm developers, and robust worst‐case wind shear situations are not established specific to local site conditions.
ISO 9613‐2 indicates a ±3dB level of prediction uncertainty for the conditions it was validated for. It was not validated for use with high-level noise sources under high wind shear, turbulence and high wind speeds as apply for wind turbines. In these cases the degree of under-prediction is likely to be significantly greater than ±3dB.
The current guidance, ETSU and the NWG draft guidelines are totally deficient from a scientific perspective with respect to noise prediction.
Amplitude Modulation
Amplitude modulation is the most important noise characteristic of wind turbines so excluding it from the IoA review of the guidelines must be of concern.
Additionally, no credibility can be given to any future report on this subject commissioned by the industry trade association RenewableUK. This will have the same credibility as studies into health effect of smoking conducted by the tobacco industry.
This summarises AM as detailed in WEIS:
Turbine manufacturers will understand the problem very well but are not going to share such information.
This diagram is taken from page 39 of the MAS Environmental report ref 10 dated 4 Jan 2010 that analysed the noise assessment for the New Albion wind farm. This shows the short-term variability of turbine noise at Warboys when the dB LAeq is measured at 125ms intervals.
 [17]
[17]
In this case short term background noise must be at least 3dB lower than the lowest LAeq readings that are inclusive of background noise at a level of around 33dB. As a result we have turbine noise peaks of up to 10dB above an actual background level of 30 dB and 5.5dB above the inclusive (10 minute) period LA90 level of 35dB.
Applying either BS 4142:1990 or :1997 assessment procedures, with a +5dB addition for noise character described as “regular variation and thumps”, a rating level of +12 dB above background results. This is 7 dB above the “marginal significance” upper limit and 2 dB into the “complaints likely” condition.
It must be emphasized that in this case with a 10 metre height wind speed of less than 5m/s all the conditions are satisfied for application of BS 4142 when assessing an industrial noise source in a residential area.
Conversely the (10 minute) period LA90 would be lower than the ETSU‐97 night time limit by 8dB, which ignores both period and short term LAeq levels and adjustment for character. Quoting from the MAS report at para A1.39: “Graph AM Warboys – AM at 1000m from the nearest turbine at Warboys. It was substantially below the ETSU‐R‐97 limit of 43dB LA90 at night but was the dominant noise and intrusive due to the regular variation and thumps. This was not the worst case as it was not directly downwind but at 60 degrees angle to the nearest turbine. The modulation was of 3–5dB. It was clear and audible both outside and inside my car. There were only rarely any other sounds within the noise environment.”
In conclusion we see that the public have very little statutory protection from any harmful effects of EAM. We recognised that the existence or otherwise of health effects attributable to it is controversial.
Noise Limits
The IoA NWG does not have the inputs to enable health impacts to be determined, yet their conclusion have implications for such possible effects.
We should add here that BS 4142 on page 6 sect 8.1 states:
“Certain acoustic features can increase the likelihood of complaint over that expected from a simple comparison between the specific noise level and the background noise level. Where present at the assessment location, such features are taken into account by adding 5dB to the specific noise level to obtain the rating level.”
Sect 8.2 goes on to qualify this including: “the noise contains distinct impulses”. This certainly describes wind turbine noise even without what is described as excess amplitude modulation.
ETSU does not provide for including this tonal penalty for normal blade swish as would BS 4142.
Only ETSU allows higher noise levels at night than during the day.
With turbine noise levels just below the 43 dB LA90 limit, complaints would be virtually guaranteed in quiet rural locations.
We need these limits to be based on scientific and medical fact, not guesswork.
Low-Frequency Noise
There is evidence from studies elsewhere in the world that LFN is a problem. For the first time we have agreement by consultants acting for both sides in this dispute that:
Report published in Noise & Health [ref 9] Oct 2012 provides clear evidence of sleep disturbance and mental health effects on residents living within 1.4km of turbines.
Report published Dec 2012 (Wisconsin report) [ref 7] jointly by four consultants acting on behalf of both the developer and local residents confirmed: “LFN and infrasound as a serious issue, possibly affecting the future of the industry. It should be addressed beyond the present practice of showing that wind turbine levels are magnitudes below the threshold of hearing at low frequencies.”
Wisconsin report [ref 7] findings included:
The highly significant fact here is that the noise while either not audible or barely audible is causing adverse health effects.
Note that Hessler Associates are well known for representing US wind farm developers.
Measuring equipment suitable for detecting LFN was used during this survey revealing high levels of LFN inside the homes.
Rand Acoustics [ref 7] reported:
Rand Acoustics [ref 7] concluded:
Yet again more research is needed. Sweeping possible issues under the carpet in order to allow the onshore wind industry access to virtually every site it wants will not help.
The turbines used most frequently at UK wind farms now have rotor diameters of 80 or 90m so will operate at close to the critical blade passing frequency as shown here:
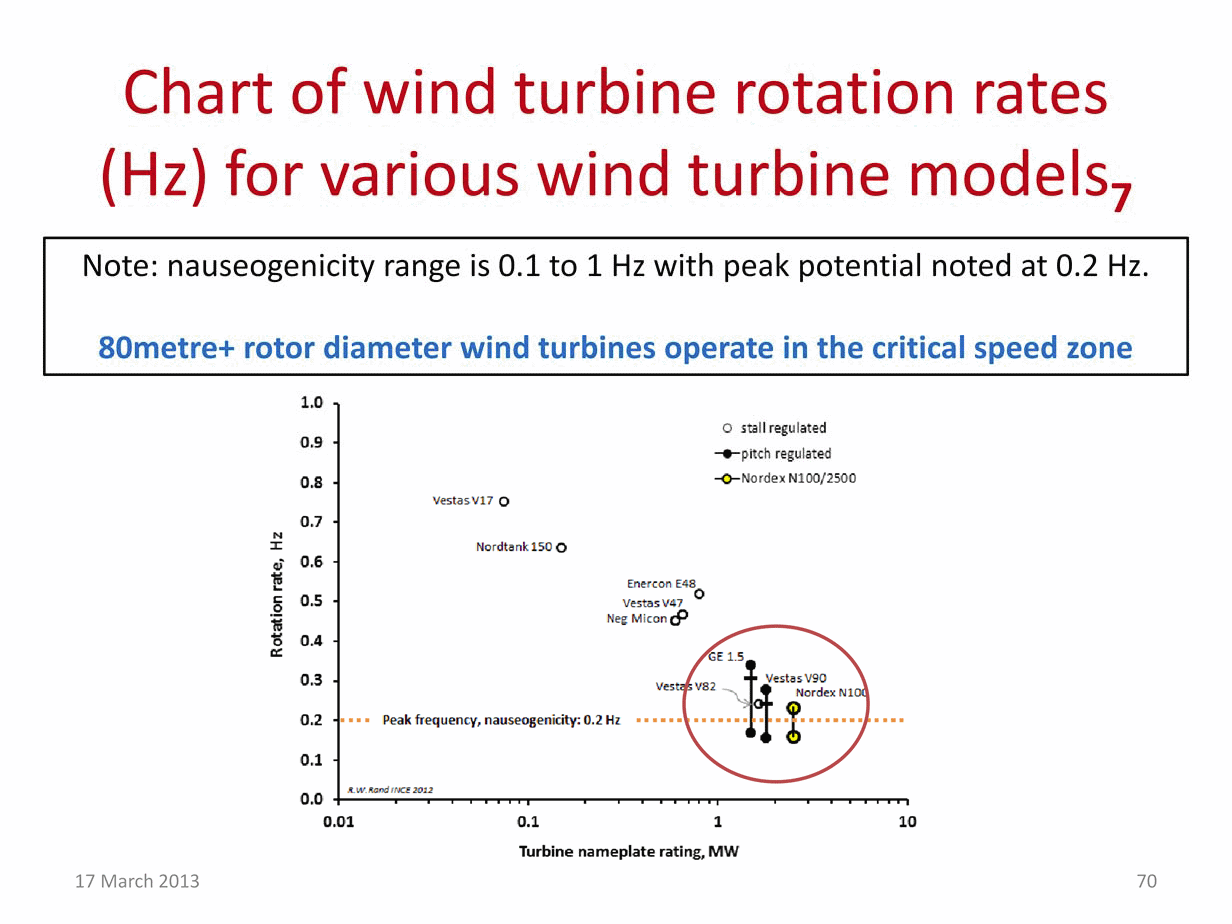 [18]
[18]
Schomer & Associates [ref 7] reported:
The octave band data we have seen presented by developers, obtained by turbine manufacturers only goes down to 63Hz whereas the Wisconsin report is discussing frequencies down to 10Hz.
This is the first time we have clear evidence of high levels of LFN and that A weighting measurement is inappropriate.
We should also add here that IEC 61400 [ref 19] at sections A2 and A3 recognises the potential for infrasound (below 20Hz) and LFN (between 20 Hz and 100Hz) causing annoyance even though barely audible and that noise may be underestimated if assessed using only an LAEQ value.
Noise nuisance and ill heath effects are occurring due to turbine LFN even when the noise is inaudible or barely audible.
This dispels the ETSU core principles that:
Summarising the Assessment Uncertainties
We have seen that ETSU‐R‐97 compares the measured ‘background’ noise with that predicted for the turbines over a range of wind speeds.
We have also seen that turbine noise prediction is not an exact science and that there are problems in the sampling and measurement of the background. This introduces considerable uncertainty into the predictions, almost certainly more than the simple ‘model error’ usually quoted.
There are also uncertainties in how the background data are processed to arrive at summary measures that can be compared with the turbine noise prediction. How do these all combine to affect the security of the overall noise assessment?
Once again, we note that the acoustic science used in ETSU‐R-97 must be the only example of an exact science other than hindsight known to mankind. The responsible scientist should recognise these uncertainties, and draw attention of any planning decision makes to them. The implications for wind farm evaluation and the planning system are not of direct scientific concern and anyhow will vary from site to site.
Plank A: Background noise:
It is hard to give precise estimates here but fairly conservative ones are: sources 1–4, say ±5dB; source 5, say ±2dB. Assuming independence, these combine to give an uncertainty in Plank A of ±5.38dB.
Plank B: Turbine noise:
Even the ISO 9613 method suggests a model error of around ±3dB. We believe that this is extremely optimistic, given the application of a model in situations that are way outside the parameter space in which it was originally validated, so even ±8dB is a real possibility.
These may well be conservative estimates. Assuming these are independent we have a
pooled uncertainty of SQRT(5² + 8²) = ±9.43dB.
This represents a halving or doubling of loudness and should be considered against the claimed headroom for the selected receptors. In many cases this is less than 3dB, sometimes even less than 1.0dB.
It is virtually certain that a proportion of wind farms consented under ETSU will generate justified noise complaints. ETSU does not afford the protection to citizens that its originators thought it would.
ETSU is clearly unfit for purpose and should be replaced with new science-based guidelines.
Greater transparency is required:
Other recommendations:
These recommendations are based on our lack of confidence in the Institute of Acoustics Noise Working Group.
It is proposed that most of the existing IoA NWG members be replaced to ensure independence (perceived and real) and the group strengthened with the required mix of specialist scientific and medical skills.
David Unwin is a retired academic geographer and environmental scientist. Richard Cox spent over eight years in the Royal Navy as an electrical artificer working on naval aircraft; as an electrical engineer in the power generation industry he was involved in the construction, commissioning, maintenance and life extension of nuclear and fossil fired power stations for over 30 years in both technical and commercial roles. Dr Rod D Greenough is Emeritus Reader in Physics in the University of Hull; he is co-director of an SME specialising in the application of audible sound for non-destructive condition monitoring and the application of technologies to cancel audio noise. Doug Bingham is a retired acoustic consultant formerly employed by A V Technology Ltd of Cheadle Heath; prior to that he was an engineering manager for Hawker Siddeley Power Engineering responsible for the core projects mechanical engineering department, which included noise and vibration disciplines, and a director of Pax Acoustic Engineering Ltd, an AVT subsidiary noise control hardware company.
URL to article: https://www.wind-watch.org/documents/bad-science-behind-the-wind-turbine-noise-guidelines/
URLs in this post:
[1] Neglect of Wind Shear in Assessing Long Range Propagation of Wind Turbine Noise: https://docs.wind-watch.org/wind-shear-turbine-noise-propagation.pdf
[2] ‘Where ETSU Is Silent’: https://wind-watch.org/doc/?p=3016
[3] Image: https://docs.wind-watch.org/BadSci-25.gif
[4] Image: https://docs.wind-watch.org/BadSci-28.gif
[5] Image: https://docs.wind-watch.org/BadSci-37.gif
[6] Image: https://docs.wind-watch.org/BadSci-39.gif
[7] Image: https://docs.wind-watch.org/BadSci-42.gif
[8] Image: https://docs.wind-watch.org/BadSci-43.gif
[9] Image: https://docs.wind-watch.org/BadSci-44.gif
[10] Image: https://docs.wind-watch.org/BadSci-45.gif
[11] Image: https://docs.wind-watch.org/BadSci-46.gif
[12] Image: https://docs.wind-watch.org/BadSci-48.gif
[13] Image: https://docs.wind-watch.org/BadSci-49.gif
[14] Image: https://docs.wind-watch.org/BadSci-50.gif
[15] Image: https://docs.wind-watch.org/BadSci-51.gif
[16] Image: https://docs.wind-watch.org/BadSci-52.gif
[17] Image: https://docs.wind-watch.org/BadSci-59.gif
[18] Image: https://docs.wind-watch.org/BadSci-70.gif
[19] link: https://www.wind-watch.org/documents/where-etsu-is-silent-wind-turbine-noise-impact-assessment/
[20] link: https://www.wind-watch.org/documents/cooperative-measurement-survey-and-analysis-of-low-frequency-and-infrasound-at-the-shirley-wind-farm/
[21] link: https://www.wind-watch.org/documents/effects-of-industrial-wind-turbine-noise-on-sleep-and-health/
[22] Download original presentation and notes: “The ‘Bad Science’ behind the wind turbine noise guidelines”: https://docs.wind-watch.org/BADSCI-lr.pdf