The Government is committed to obtaining 15 per cent of all its energy from renewable sources by 2020 and offshore wind power has been identified as the key factor in reaching the target. But not everybody agrees
This article was prepared by Kentish Weald Action Group (KWAG) set up to oppose wind turbines in rural Kent
The Government seems intent on covering the whole country with massive wind turbines.
Approval has apparently been granted for an onshore 7.5MW turbine, 650 feet high, to be built in Northumberland.
On 10 July Hazel Blears approved the long contested Glyndebourne turbine and demonstrated that even Areas of Outstanding Natural Beauty are now at risk.
The wind industry has a very well-funded propaganda machine and powerful lobbyists. This article, using previously unpublished data, is an attempt to redress the balance, to cut through the fog of misrepresentation, and establish one simple fact which the wind industry does not like the public or the Government to understand:
Virtually all the energy contribution from onshore wind turbines will have to be backed-up.
When the wind stops
In its UK Renewable Energy Strategy consultative document, the UK Government suggests that 32 per cent of electricity might come from renewable sources by 2020 in order to meet the overall renewable energy target of 15 per cent set by the EU.
To achieve this, it is proposed that 22 of the 32 per cent should be provided by onshore and offshore wind.
The purpose of this article is to make a serious contribution to the national debate currently underway and to establish, once and for all, one very basic and simple fact.
Despite what one might be led to believe by the British Wind Energy Association (BWEA) and other wind lobbyists there are relatively frequent periods when there is virtually no wind and, therefore, virtually no output from wind turbines, however wide their distribution throughout the UK.
These low wind periods are more likely to occur in the winter months (when demand is higher) and the irrefutable fact is that, in order to meet peak demand in these periods, the capacity allocated to wind turbines would have to be provided by other energy sources. At certain times this back-up would have to be almost 100 per cent of that estimated wind turbine capacity.
The Government's Renewable Energy Strategy Document, in paragraph 3.9.4, states that 10-20 per cent of capacity can be statistically relied upon for being available at peak demand.
Given that the load factor (i.e. the average energy output as a percentage of total theoretical capacity) for onshore turbines has been assumed to be 29 per cent in the document, this statement is, in effect, saying that 30-60 per cent of assumed output can be relied upon; not only an absurdly high assumption but a nonsensical range of uncertainty.
No source is given for this assertion but the document also states the following in paragraph 3.92.
"With a good dispersion of wind turbines, the variability of wind output over the UK as a whole can be expected to be smoother than output from any individual site or region."
The source quoted for that statement is the University of Oxford's, Environmental Change Institute (ECI), Wind Power and the UK Wind Resource 2005.
The ECI report referred to, which was compiled by Dr Graham Sinden in 2005, also includes the following:
"Extreme lows or highs in wind speed are a natural feature of the UK wind climate; however a diversified wind power system would be less affected as it is rare that these extreme events affect large areas of the country at the same time. This report found that:
"Low wind speed conditions affecting 90 per cent or more of the UK would occur in around one hour every five years during winter."
As demonstrated later in this article, the first sentence in this quote is complete nonsense. The last, as it stands, might well be correct.
However, the fundamental flaw in Dr Sinden's presentation of the facts is that he defines low wind speeds as being less than 4ms (ms = metres per second).
At 4ms and slightly above, wind speeds are still very low and output from turbines is a negligible percentage of their total theoretical capacity. His own report shows that the 2,500KW turbine he uses as an example only produces 15KW at 4ms and 255Kw at 6ms.
According to Dr Sinden, he studied over 30 year's worth of hourly wind speed data from 60 sites, so he must be aware of the facts. Yet, he chooses to make statements which are clearly intended to leave the reader believing that dispersion of turbines results in output averaging out to an acceptable level.
As this article will show and, as Dr Sinden must know, this is simply not the case.
The report is fundamentally flawed and misleading but continues to be used by the Government and others to support their claims. Dr Sinden himself, who is now on the Renewable Energy Advisory Board, continues to make similar assertions in order to promote wind development in the UK.
Although the BWEA and others attempt to confuse the issue and everybody, by talking about balancing requirement, capacity credits and percentages of capacity and percentages of output, the question that arises is, very simply - what percentage of installed wind capacity can be statistically relied upon to meet peak demand? It is important to be sure of this, to determine what back-up capacity is required.
The BWEA, in its evidence to the House of Lord's Economic Affairs Committee submitted in June 2008, and relying on a report issued by the UK Energy Research Centre, states (paragraph 11) that:
"Additional costs are attributable to the relatively low 'capacity credit' that wind power has: this factor reflects how much wind power can be expected to contribute when demand for electricity is at its peak, and this is 20-30 per cent of the nameplate capacity of the wind generators."
Given that the load factor assumed for onshore turbines is only 29 per cent of installed capacity, to claim that 20-30 per cent of installed capacity can be statistically relied upon at times of peak demand is clearly an irresponsible assertion, even if sourced from a report issued by others. The BWEA knows that this is nonsense but is happy, nevertheless, to present it as evidence to the House of Lords.
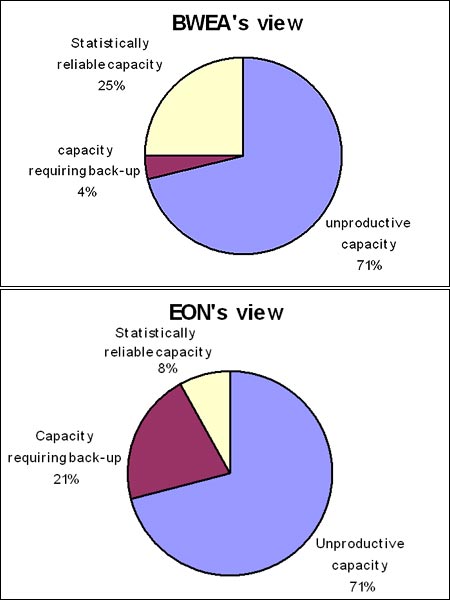
BWEA's evidence, not surprisingly, is completely contradicted by E.on's evidence to the same Committee, also presented in June 2008. In E.on's supplementary evidence to the Committee (on the same website) they make it very clear, based on their practical experience, that only 8 per cent of capacity can be relied upon in winter months:
"Our assessment of winter wind generation data in 2007 indicates that the system operator could rely on 8 per cent of total UK wind capacity to meet winter peak demand at the same level of dependability as thermal plant.
"On this basis, if the UK required, say, 40,000MW of wind capacity to meet its renewable target by 2020, only 8 per cent of this renewable capacity (3,600MW) could be relied on to meet winter peak demand.
"This would avoid the need to build 3,600MW of new thermal plant but the remaining 36,400MW of renewable capacity would need to be 'backed-up' by thermal plant to meet winter peak electricity demand in 2020."
If one, somewhat generously, takes BWEA's capacity credit as being at 25 per cent, as opposed to 30 per cent, and the load factor of onshore turbines as being 29 per cent the comparison is as follows.
|
|
E.on is one of the companies with the most responsible attitude towards wind development (minimum buffer- zones between houses and turbines, not proceeding with projects if noise levels cannot be met etc.) On top of that, they have a wealth of practical experience.
The BWEA is the mouthpiece of the wind development industry in the UK, the CEO, Maria McCaffery, still refers to anyone who opposes wind development as a Nimby and has failed to issue adequate guidelines to the wind industry to prevent severe blight to peoples' lives and homes from turbines in close proximity to dwellings. E.on's evidence is serious; the BWEA's should be disregarded.
In their evidence, E.on also makes the point that: "The extent to which wind speed, and thus output from wind generation, correlates with periods of high electricity demand is important in assessing the extent to which we can rely on wind generation to meet winter peak electricity demand.
"Winter is generally windier than the summer, with the median output for a winter day higher than in the summer. However, on the coldest days (with temperatures below zero), there tends to be little to no wind, corresponding to winter anti-cyclones.
"There is an increased risk of very low wind speeds, with wind generation output less than 10 per cent of theoretical maximum, on high demand days."
Not only is E.on's evidence serious but their estimate of the impact of the winter anti-cyclones is actually understated, as will be demonstrated by the analysis below.
William Hyde, a Chartered Engineer and retired South Eastern Electricity Board engineering manager, has taken three daily readings from 30 Met Office weather stations across the whole UK for October, November, December 2007 and February 2008. Data (one reading at midday) has been obtained for 26 weather stations from the Met Office for January 2008.
The recorded wind speeds have then been factored up by 20 per cent (consistent with the table provided by the Danish Wind Energy Association) to get assumed wind speeds at a turbine hub height of 80m and, finally, converted into turbine electricity output using the technical data for the Nordex80 turbine.
The Renewable Energy Foundation has done excellent work to show that weather patterns cover the whole country but we are quite sure that detailed information, such as shown on the charts using this data, has not been published before.
These charts not only provide strong evidence that the statements made by E.on in respect of anti-cyclones are correct but, more specifically, that there are periods in the UK when there is virtually no wind in winter months (when more electricity is required) and there is no smoothing to a higher average coming from turbine distribution. This is always disputed by the wind companies but quite evident.
The charts assume an even distribution of turbines across the UK. The BWEA always argues that this is essential to ensure security of supply and is the justification for installing turbines as widely as possible. This claim was again made recently, in response to the concerns raised by Sir David King, reported in the Financial Times.
The reality, however, is that the same weather pattern can cover the whole UK for a period of time and result in extremely low output from turbines, however widely dispersed.
Although our data and charts can be checked and replicated, we have taken one further step in order to counter the further spin and outraged huff and puff we might expect from the BWEA, Dr Sinden and others. Daily turbine output from wind turbines in Germany is available on REISI Renewable Energy Information System on the Internet.
We have used this data to prepare similar charts for Germany for the same months to check the correlation. Not only is there a remarkable consistency between the charts but the output percentages demonstrate quite clearly that these winter high-pressure systems can, not only sit across the entire UK, but also cover a large part of Europe at the same time. This is, of course, no news to anyone who has a basic understanding of meteorology.
|
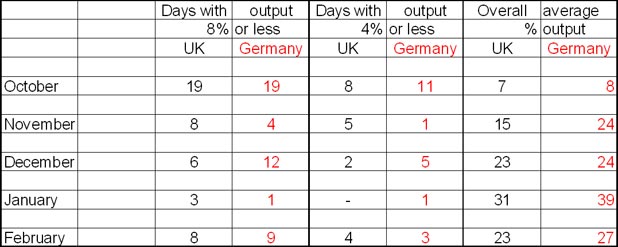
In October 2007, based on our data, there were 19 days when average wind turbine output in the UK would have been at 8 per cent of capacity or below and certain days when output would have been close to zero; the overall average output for October was 8 per cent.
In Germany, of the 16,368 of theoretically maximum GWh that could have been produced in October (calculated by taking the 22GW of installed German wind turbine capacity x 31 days x 24 hours ), only 1,318 GWh were actually produced, an overall average output of 7 per cent; output in Germany was also, like the UK, at 8 per cent or below on 19 days.
The data from the charts for the two countries (available as click-to-enlarge graphics) is summarised in the above chart, the percentages being percentages of total installed wind turbine capacity.
|
|
|

|
|
This provides firm evidence that even relying on 8 per cent, as being the statistically reliable percentage of capacity that will always be available, is overly optimistic.
In the five months in question, total output in Germany, astonishingly, dropped below 2 per cent on 11 days.
As demonstrated by our derived data, exactly the same pattern will occur in the UK and it is perfectly clear that virtually all the estimated output from the installed onshore turbine capacity in the UK will have to be backed-up.
Offshore capacity will require similar backup, maybe to a lesser extent if the alleged offshore higher reliability is achieved.
Although our analysis has focused on the winter months there may well be similar problems at other times of the year, particularly in the Spring and Autumn, when generating plant is out of commission for maintenance.
While the Government issues yet more consultative papers, the French are simply building up their nuclear capacity.
President Sarkozy has just announced approval of a second third-generation nuclear reactor.
At the same time, as reported in the Figaro (4 July, 2008), he made it clear that not only does France intend to become totally energy independent but it also intends to seize the opportunity to become an exporter of electricity.
Finally, it is perhaps worth pointing out that the Government's Strategy document has an assumed load factor for offshore turbines of 41-42 per cent.
Given that current offshore load factors are no more than 29 per cent this assumption would appear to be absurd.
If 29 per cent is closer to the truth, there would clearly be a significant shortfall in meeting the Government's renewable energy targets and one can only assume that such a shortfall would have to be met by more onshore turbines.
It is hoped that this article will do something to disperse the smokescreen put up by the BWEA and others.
One should bear in mind that individuals in the wind development companies and investors are making a considerable amount of money from over-subsidised onshore turbines.
They bear none of the incremental costs required to support an intermittent and, at times, virtually non-existent energy source.
This cost is borne by the consumers, as is the cost of the subsidy payments that make the investment returns for turbines so high.
It is little less than Government sponsored robbery of the poor for the benefit of the rich.
William Hyde, DFH, C.ENG, Fellow IET and John Webley, Chairman, KWAG. www.kwag.co.uk